What Is Application Monitoring?
Application monitoring is the process of tracking performance, availability, and user interactions for software applications. This involves collecting data related to the application’s operations, analyzing performance metrics, and ensuring that the application functions correctly and efficiently.
Monitoring helps identify any issues that may affect the user experience or the application’s functionality, enabling timely troubleshooting and maintenance. The scope of application monitoring spans from detecting critical errors, such as system crashes and failed transactions, to tracking slower-than-expected response times and functional glitches.
An effective monitoring strategy encompasses various types of monitoring tools and techniques designed to provide a comprehensive view of an application’s health across different environments, whether it be in development, testing, or production.
Application monitoring provides several important benefits for application development and operations teams:
- Issue detection and resolution: Application monitoring tools alert developers and IT professionals to problems early, often before users notice any disruptions. This allows for quicker diagnosis and resolution, avoiding negative user experiences.
- Improved performance: Monitoring provides real-time metrics on various performance indicators such as load times, response times, and resource utilization. This enables teams to optimize application performance, and supports capacity and scaling decisions.
- Improved security: Monitoring tools can detect unusual activities or potential security breaches in real-time, allowing for immediate action to prevent data loss or damage. This includes monitoring for suspicious patterns of user behavior, failed login attempts, or unusual changes to application data.
This is part of an extensive series of guides about application security
Application Monitoring vs. Application Observability
While closely related, application monitoring and application observability serve distinct roles. Monitoring involves actively watching and alerting on predefined metrics and logs to maintain the application’s performance and availability. It’s a more traditional, reactive approach focusing on known problems and their immediate resolution.
Table of Contents
ToggleObservability, on the other hand, is about understanding the internal state of the system from its external outputs. It’s a more proactive and comprehensive approach, allowing developers to ask arbitrary questions about their applications without needing to add new instrumentation. This capability is crucial for diagnosing unforeseen issues and understanding complex system behavior in depth.
What Is Application Performance Monitoring?
Application performance monitoring (APM) focuses on measuring application performance to ensure it meets predefined standards and expectations. APM tools collect data on various metrics, such as response times, error rates, and throughput, providing insights into how well the application performs from the end user’s perspective. This information helps teams identify areas for improvement, optimize performance, and enhance user satisfaction.
The APM process involves instrumenting the application code with agents or SDKs that gather performance data. This data is then analyzed, often in real time, to detect anomalies or trends indicating potential performance issues. By addressing these issues proactively, teams can ensure their applications remain efficient, responsive, and competitive.
Cloud-Based vs. On-Premises Application Monitoring
Cloud-based monitoring, hosted on service providers’ infrastructure, offers scalability, flexibility, and the advantage of low upfront costs. Organizations can quickly set up and scale their monitoring solution without extensive hardware or maintenance investments, making it an attractive option for businesses of all sizes.
On-premises monitoring, on the other hand, provides complete control over the monitoring environment, which is crucial for organizations with strict data governance or regulatory compliance requirements. While it requires more significant initial investment in infrastructure and ongoing maintenance, it gives businesses full authority over their monitoring tools and data, offering enhanced security and customization possibilities.
Types of Application Monitoring
Application monitoring can be categorized based on the aspect of an application being monitored:
Performance Monitoring
Performance monitoring focuses on how well an application responds to user requests, emphasizing speed, resource utilization, and scalability. It involves tracking metrics like response times, server load, and transaction volumes to ensure the application performs optimally under various conditions.
Identifying performance bottlenecks and inefficiencies allows teams to make necessary adjustments, improving application speed and reliability. This type of monitoring enhances user satisfaction by providing a smooth, responsive experience. It also helps in optimizing resource consumption, reducing operational costs.
Error and Exception Monitoring
Error and exception monitoring targets application stability by identifying, reporting, and managing coding errors and exceptions that occur during runtime. This proactive approach alerts developers to issues as they arise, allowing for swift resolution before they impact the user experience.
By analyzing error patterns and frequencies, teams can pinpoint underlying issues, leading to more robust and error-free applications. Beyond immediate issue resolution, this type of monitoring helps in understanding the root causes of errors, facilitating long-term improvements in application stability and reliability.
Dependency Monitoring
Dependency monitoring tracks the performance and health of external services and components that an application relies on, such as databases, APIs, and third-party services. Monitoring these dependencies is crucial as any degradation in their performance can directly impact the application’s functionality and user experience.
By identifying issues within dependencies early, teams can take corrective measures, like switching to alternative services or working with providers to resolve the issues. This monitoring ensures applications remain resilient, even in complex environments with numerous interdependencies.
Traffic Monitoring
Traffic monitoring analyzes the volume and nature of user requests to identify trends, peak usage periods, and potential security threats. By understanding traffic patterns, organizations can optimize their infrastructure to handle load effectively, ensuring the application remains responsive during demand spikes.
Traffic analysis also helps in detecting and mitigating distributed denial-of-service (DDoS) attacks, ensuring the application’s availability is not compromised. Insights gained from traffic monitoring guide strategic decisions, like capacity planning and geographic expansion, by highlighting user engagement trends and regional demand.
Business Transaction Monitoring
Business transaction monitoring focuses on the workflow and outcome of critical processes within applications, such as checkout procedures in eCommerce platforms or fund transfers in banking applications. By ensuring these transactions are completed successfully and efficiently, organizations can directly impact their bottom line and customer satisfaction.
Monitoring these transactions in real-time helps identify and resolve issues quickly, preventing revenue loss and maintaining trust. This monitoring type also provides valuable insights into user behavior and transaction success rates, informing business strategy and operational improvements.
Security and Log Monitoring
Security and log monitoring consolidate and analyze application and system logs to identify security incidents, policy violations, and operational issues. This comprehensive view of application activity helps in trend analysis, forensic investigation, and compliance reporting.
By detecting anomalous behavior or unauthorized access attempts in real-time, organizations can thwart potential security breaches and mitigate risks effectively.
5 Notable Application Monitoring Tools
Faddom
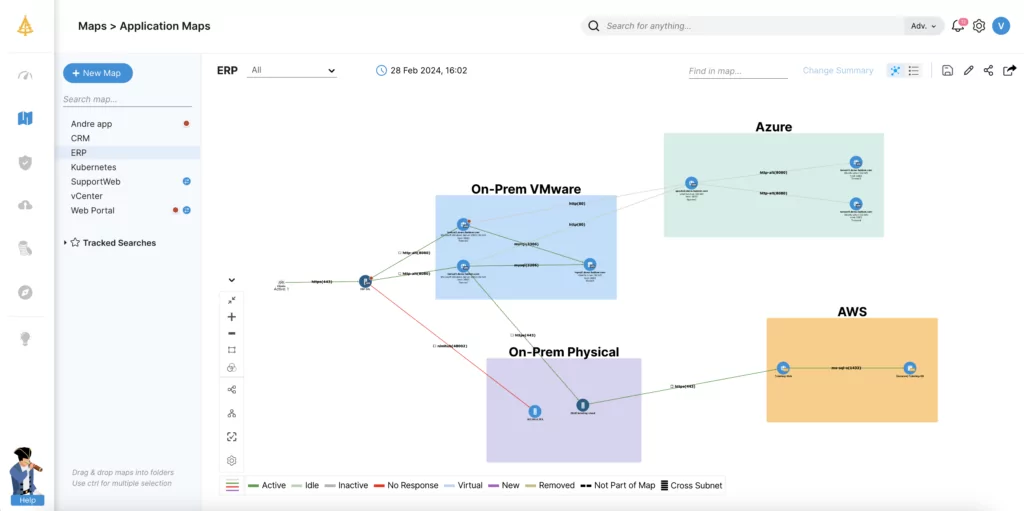
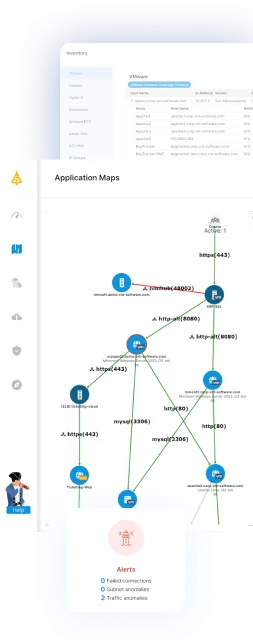
Faddom is a network and application monitoring solution that provides comprehensive visibility into your IT environment. It specializes in mapping and monitoring the relationships and dependencies between applications, hosts, and services.
With its ability to detect and visualize the entire IT infrastructure in minutes, Faddom helps IT teams quickly understand the impact of network or application performance issues across the environment. This tool is particularly useful for troubleshooting complex issues, planning changes, and improving overall IT operational efficiency.

Learn more about Faddom or start a free trial to the right
Dynatrace
Dynatrace offers a full-stack monitoring solution, using artificial intelligence to automatically monitor, analyze, and optimize applications, cloud infrastructure, and user experiences. It provides analytics for performance management, cloud operations, and application security.
Dynatrace’s ability to auto-detect and diagnose issues at the code level provides actionable guidance for developers and helps teams resolve problems quickly.
Source: Dynatrace
Datadog
Datadog is a cloud-based monitoring service for servers, databases, tools, and services. It analyzes monitoring data with its SaaS-based data analytics platform. Datadog performs real-time analysis of logs, performance metrics, and application traces across the full stack, enabling teams to observe and manage their applications in different environments.
Datadog integrates with various cloud providers and tech stacks, making it suitable for monitoring a diverse range of cloud infrastructure and applications.
Source: Datadog
New Relic
New Relic’s application monitoring tool offers in-depth analysis of your application’s performance and user experiences. It provides insights into transaction times, error rates, and throughput across web and mobile applications, enabling developers and IT operations to pinpoint performance issues.
New Relic supports real-time analytics, allowing teams to make data-driven decisions quickly. It also provides a customizable dashboard and alerting system.
Source: New Relic
IBM Instana
IBM Instana is an application performance monitoring and observability solution designed for modern cloud-native applications. It provides automated discovery of application service components, real-time performance metrics, and end-to-end tracing of requests across microservices environments.
Instana’s use of artificial intelligence for automatic problem detection and root cause analysis simplifies the management of complex applications. It offers deep visibility into application performance and user experiences.
Source: IBM
Learn more in our detailed guide to application monitoring tools
Application Monitoring Best Practices
Here are some best practices to ensure thorough and accurate monitoring of applications.
1. Set Meaningful Alerts
It’s important to calibrate monitoring systems to notify teams about critical events while minimizing noise from false alarms. Alerts should be actionable, tied to significant performance thresholds or anomalies that genuinely require attention. Structuring alerts around business-critical metrics ensures that teams focus on issues that directly impact application performance and user satisfaction. Additionally, addressing the frequency, volume, and complexity of security alerts is crucial for solving alert overload and enabling IT teams to respond effectively without being overwhelmed.
2. Leverage Real User Monitoring
Real User Monitoring (RUM) captures and analyzes user interactions with applications in real-time, offering insights into actual user experiences across different devices and networks. This visibility into user behavior and application performance from the user’s perspective is invaluable for identifying usability issues, optimizing content delivery, and personalizing user experiences.
Implementing RUM enables organizations to make data-driven decisions about UX improvements and performance optimizations. By focusing on real-world user feedback, businesses can ensure their applications meet and exceed user expectations.
3. Utilize Log Management and Analysis
Effective log management and analysis entail collecting, storing, and analyzing log data from applications and underlying infrastructure. This comprehensive log data provides a granular view of application behavior, facilitating troubleshooting, security monitoring, and compliance auditing. Automated log analysis tools can detect patterns and anomalies indicative of operational or security issues, enabling proactive resolution.
4. Leverage Chaos Engineering for Resilience Testing
Chaos engineering involves intentionally introducing disruptions to applications or infrastructure to assess resilience and recovery capabilities. By simulating real-world incidents, teams can identify weaknesses in their systems before they impact users, allowing for strategic improvements in reliability and performance. This practice encourages a proactive approach to system design, focusing on building systems that can recover from unexpected failures.
5. Monitor Across Multiple Dimensions
Comprehensive application monitoring spans several dimensions, including performance, user experience, security, and infrastructure health. Monitoring across these dimensions provides a holistic view of the application, enabling a more effective response to issues and trends. Integrating different monitoring tools and approaches ensures coverage across all critical aspects of application functionality and performance.
6. Map Application Dependencies
Understanding and mapping application dependencies is crucial for effective monitoring and troubleshooting. This involves identifying how different components of an application interact with each other and with external services, databases, and APIs. Knowing these dependencies helps in pinpointing the root causes of performance issues or failures more quickly, as problems in one area can have cascading effects on others.
Mapping dependencies is also essential for planning system updates or changes, as it highlights potential impacts on interconnected services. By maintaining an up-to-date dependency map, teams can ensure more reliable application performance and reduce downtime during maintenance or unexpected outages.
Learn more in our detailed guide to application monitoring best practices
Conclusion
Application monitoring is a critical component of modern software development and operations, ensuring that applications not only meet performance benchmarks but also provide a seamless and secure user experience. By leveraging a mix of monitoring types, tools, and best practices, organizations can preemptively identify and address issues, optimize application performance, and maintain high levels of user satisfaction.
As technologies evolve and applications become more complex, the role of application monitoring will continue to grow in importance. A continuous commitment to monitoring and improvement is essential for achieving the reliability, performance, and security demanded by today’s users.
Learn more about Faddom for application optimization, or book a demo by filling out the form on the sidebar!
See Additional Guides on Key Application Security Topics
Together with our content partners, we have authored in-depth guides on several other topics that can also be useful as you explore the world of application security.
Application Migration
Authored by Faddom
- [Guide] Application Migration: Prep, Strategies & Tips for Success
- [Guide] What is IT Migration Planning?
- [Product] Faddom | Instant Application Dependency Mapping Tool
API Security
Authored by Pynt
- [Guide] API Security: Threats, Tools, and Best Practices
- [Guide] API Attacks: 6 Common Attacks and How to Prevent Them
- [Product] Pynt | Offensive API Security Testing Platform
API Security Testing
Authored by Pynt


