How Do You Monitor Applications in AWS?
Application monitoring involves tracking the performance and health of applications. It aims to ensure these applications run optimally and efficiently, offering insights into their operation. By continuously monitoring applications, developers and IT professionals can detect issues early, troubleshoot problems, and improve the user experience.
While there are many ways to monitor applications in AWS, the Amazon platform provides several tools and services you can use to monitor your applications. These solutions offer real-time data on application performance, including metrics on latency, error rates, and system health. We’ll discuss three commonly used tools—Amazon CloudWatch, with a special focus on its new Application Signals feature, Amazon X-Ray, and Amazon CloudTrail.
Table of Contents
ToggleAWS Tools for Application Monitoring
Here’s an overview of the AWS services that can be used to monitor applications.
Amazon CloudWatch
Amazon CloudWatch is a monitoring service for AWS cloud resources and the applications running on AWS. It collects and tracks metrics and log files, sets alarms, and automatically reacts to changes in AWS resources.
CloudWatch can monitor resources such as Amazon EC2 instances, Amazon DynamoDB tables, and Amazon RDS DB instances. It provides system-wide visibility into resource utilization, application performance, and operational health.
CloudWatch allows users to set alarms and automate actions based on predefined thresholds or schedules. For example, if the CPU utilization of an EC2 instance goes above a certain percentage, CloudWatch can send notifications or automatically adjust resources to handle the load, helping to maintain application performance and availability.
Source: Amazon
AWS X-Ray
AWS X-Ray helps developers analyze and debug production, distributed applications, such as those built using a microservices architecture. It shows you how your application and its underlying services are performing to identify and troubleshoot the root cause of performance issues and errors.
X-Ray provides an end-to-end view of requests as they travel through your application, providing a map of your application’s underlying components. Its detailed insights allow developers to see how application components are interconnected and how requests flow through these components. This makes it easier to identify bottlenecks and service dependencies.
Source: AWS
AWS CloudTrail
AWS CloudTrail is a service that enables governance, compliance, operational auditing, and risk auditing of your AWS account. It logs, continuously monitors, and retains account activity related to actions across your AWS infrastructure, providing a detailed history of AWS API calls for your account. It covers the AWS Management Console, AWS SDKs, and command line tools.
CloudTrail is useful for tracking user activity and API usage, helping ensure the security and compliance of AWS environments. By analyzing CloudTrail logs, administrators can detect unusual or unauthorized activities and take corrective actions. It supports troubleshooting, enabling a deeper understanding of how resources and configurations affect performance.
Related content: Read our guide to application monitoring tools
What Is CloudWatch Application Signals?
CloudWatch Application Signals, a new feature introduced by Amazon as part of CloudWatch, enhances application monitoring within AWS by providing an automatic mechanism to instrument applications. It enables comprehensive monitoring of the current health and long-term performance of applications relative to set business objectives.
Application Signals offers a holistic, application-centric perspective, encompassing applications, services, and their dependencies. AWS users can gather metrics and traces directly from applications and view vital metrics, including call volume, availability, latency, faults, and errors. This is achieved without the need for custom code or complex configuration.
Another key feature of Application Signals is the automatic discovery and mapping of application topology. This presents a dynamic visual representation of applications, their dependencies, and connectivity, offering users a clear understanding of their application architecture.
Application Signals Use Cases
Here are some examples of how to use Application Signals.
Service Level Objectives (SLOs)
You can leverage Application Signals to establish service level objectives (SLOs) for business operation services. These SLOs are trackable via the SLO dashboard and provide a way to monitor the short-term status and long-term performance of your services. For businesses with service level agreements (SLAs) with their customers, SLOs help guarantee these agreements are fulfilled.
Application Signals streamlines the process of setting SLOs on crucial performance metrics by automatically gathering Latency and Availability metrics for every discovered service and operation. Through the use of an SLO creation wizard, these metrics can be used to monitor all your SLOs via the Application Signals dashboards..
Operational Health Monitoring
Application Signals enables the monitoring and troubleshooting of an application’s operational health. It provides a summary of application service operations on the Services page, which highlights services experiencing the highest rates of faults or latency and those with unhealthy SLIs.
By selecting a service, you access the relevant Service detail page, which offers metrics, service operations, Synthetics canaries, and client request data. This aids in troubleshooting and root cause identification.
The Service Map feature allows for the visualization and monitoring of your application topology over time, including the interrelations among clients, Synthetics canaries, services, and their dependencies. It shows the health of service level indicators (SLIs) and key metrics such as call volume, fault rate, and latency.
Related Content: Read our Guide about Topology Mapping
Synthetic Monitoring
Amazon CloudWatch Synthetics enables continuous verification of the application’s customer experience in the absence of real user traffic. It does this by utilizing canaries—configurable scripts that mimic user actions, which can be written in Node.js or Python. These canaries are executed on a schedule to monitor endpoints and APIs, simulating the path and activities of users.
Canaries create Lambda functions within your AWS account, using Node.js or Python frameworks. They operate over HTTP and HTTPS protocols and incorporate Lambda layers that contain the CloudWatch Synthetics library, specific to the scripting language used. This setup keeps customer data within the customer’s account, as the libraries do not transmit or store customer information externally.
CloudWatch Evidently
Amazon CloudWatch Evidently is a tool designed to manage and mitigate the risks associated with deploying new features. It allows for controlled feature rollouts to a specific segment of users, enabling performance monitoring and facilitating informed decisions about wider release schedules. This helps minimize negative impacts and identify unforeseen consequences before a full-scale launch.
CloudWatch Evidently also supports A/B testing, providing a data-driven framework for evaluating different feature variations. You can test up to five variations simultaneously, with Evidently collecting data, performing statistical analysis, and offering recommendations on the most effective options.
CloudWatch RUM
CloudWatch Real User Monitoring (RUM) offers insights into a web application’s performance from the perspective of real users. By collecting and analyzing client-side data, such as page load times, client-side errors, and user behavior, RUM provides near real-time visibility into the user experience.
RUM data is aggregated and can be broken down by various dimensions, including browser and device types, facilitating a comprehensive understanding of application performance across different user segments. RUM assists in quickly pinpointing and addressing client-side performance issues, showcasing anomalies, and providing essential debugging information like error messages and stack traces.
Best Practices for AWS Application Monitoring
Here are a few best practices that will help you make the best of native Amazon tools for application monitoring:
-
- Define clear metrics and alarms: Identify key performance indicators (KPIs) for your application and set up CloudWatch alarms to notify you of any anomalies or performance issues. This proactive monitoring can help in quick troubleshooting and maintaining optimal application performance.
-
- Use synthetic monitoring: Use CloudWatch Synthetics to simulate user interactions and monitor application endpoints for availability and performance. This is crucial for applications with fluctuating real-user traffic, ensuring consistent user experience.
-
- Map application services: This visual representation helps in understanding the interaction between different services and identifying potential bottlenecks or points of failure. Keeping an up-to-date service map is essential for effective troubleshooting and optimizing application performance.
-
- Aggregate and analyze logs: Collect and store logs using CloudWatch Logs and analyze them for insights into application behavior and potential security threats. This practice is vital for troubleshooting and understanding the context of operational issues.
-
- Automate response to events: Set up automated actions in response to CloudWatch alarms or events. This can range from scaling resources to address load changes, to triggering Lambda functions for custom remediation actions.
-
- Optimize costs: Monitor your AWS usage with CloudWatch to identify underutilized resources or opportunities for cost optimization, such as modifying instances sizes or leveraging reserved instances.
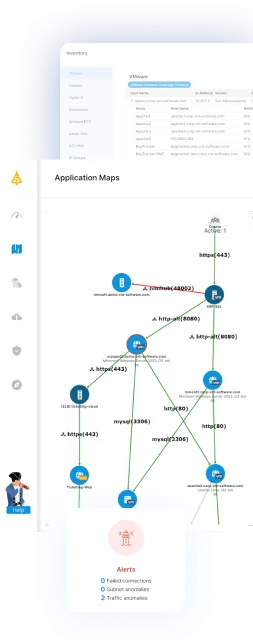
Faddom: Ultimate Alternative to Application Signals Service Mapping
Faddom offers an agentless, real-time application dependency mapping solution, providing full visibility across cloud and on-premises environments. It automatically maps dependencies, simplifying performance tracking, troubleshooting, and resource optimization, while enhancing cybersecurity by detecting vulnerabilities.
Key features include:
- Agentless mapping: Completes infrastructure mapping in under an hour, ensuring security and ease of deployment without credentials.
- Business application mapping: Visualizes IT assets and their relationship to business applications for precise resource management.
- Cost optimization: Identifies underused resources to reduce operational costs.
- Lightweight deployment: Minimizes disruption during setup, integrating smoothly with existing systems.
- Affordable pricing: Starting at $10K/year, accessible for organizations of all sizes.


