What Is Application Observability?
As the hybrid cloud becomes the domain of modern applications and app development, its rising complexity requires the use of application observability to keep up with an environment’s current state.
Application observability enables organizations to stay on top of the health of their application across its entire environment. The goal is to prevent application downtime by examining its outputs, logs, and metrics to optimize reliability, performance, and security.
Despite their symbiotic relationship, application monitoring and observability are very different. Monitoring allows operations to gain greater visibility by tracking any issues related to application performance, while observability helps DevOps and SRE teams gain greater visibility into complex microservices applications, their interactions, and how they impact the end user..
This is part of a series about application dependency mapping
Table of Contents
Toggle- What Is Application Observability?
- Why Application Observability Matters: Key Benefits
- Components of Application Observability
- Application Observability Pillars
- Tips from the Expert
- Key Application Metrics to Monitor
- Application Observability Use Cases
- Types of Application Observability Tools
- Challenges in Application Observability
- Best Practices for Application Observability
- Achieving Application Observability with Faddom Application Mapping
Why Application Observability Matters: Key Benefits
The key benefits of application observability include:
- Comprehensive insights into system behavior, providing a granular view of real-time performance under various conditions for fast issue identification and resolution.
- Easier problem detection and diagnosis that goes beyond the data noise to prioritize issues that can cause critical damage to an application’s health, operations, and end-user experience.
- Vital telemetry data to reduce MTTD and MTTR for development and site reliability engineering (SRE) teams.
- Data-driven decision-making that links application performance to business outcomes, including performance, investment, and customer experiences.
- Supporting DevOps processes with real-time data on application performance, allowing teams to improve app development speed and quality.
- Visibility for IT teams for applications and workloads across hybrid environments.
Components of Application Observability
Application observability will often include four components:
- Agents that collect telemetry data for tracking and measurement within containerized, microservices, and other infrastructure environments
- Data correlation to understand the collected data from all application sources and support for anomalous pattern discovery
- Incident response so that application support teams can respond and proactively avoid outages
- AIOps to speed incident response via AI/ML models that can automate critical processes (e.g., proactive issue detection, false alert avoidance) for faster mean time to detection (MTTD) and mean time to resolution (MTTR)
Application observability tools can have a wide range of functionalities, but they essentially fall under three pillars of observability.
Learn more in our detailed guide to application monitoring tools
Application Observability Pillars
Enterprises are often a mix of on-premises monolithic applications and cloud-native application architectures using microservices and containers. This hybrid mix requires observability tools that can deliver real-time insights into these environments, which requires delivering on the three pillars of observability:
- Metrics data collection, such as for CPU and memory usage, network traffic, and request latencies within application environments and systems such as Kubernetes
- Logs to deliver time-stamped event records that can reveal problems and their root causes
- Distributed traces, a record of events for every application request to show the source of a problem for troubleshooting
Observability is more than these three pillars, as they must act holistically to deliver a proactive understanding of problem identification, location, and resolution.

Lanir specializes in founding new tech companies for Enterprise Software: Assemble and nurture a great team, Early stage funding to growth late stage, One design partner to hundreds of enterprise customers, MVP to Enterprise grade product, Low level kernel engineering to AI/ML and BigData, One advisory board to a long list of shareholders and board members of the worlds largest VCs
Tips from the Expert
In my experience, here are tips for enhancing application observability:
-
Standardize logging formats
Use consistent logging standards across all environments to simplify data aggregation and analysis.
-
Add context to data
Tag data with details like user sessions and transaction paths to aid in prioritizing and diagnosing issues faster.
-
Deploy rich distributed tracing
Implement tracing that follows requests through microservices, attaching service names and user details for better root cause analysis.
-
Automate anomaly detection
Integrate automated anomaly detection with feedback loops to quickly identify unknown issues and reduce alert fatigue.
-
Use mapping tools for insights
Enhance observability by integrating mapping solutions like Faddom for deeper contextual analysis and visualization of application dependencies.
Key Application Metrics to Monitor
Application observability performance metrics can differ depending on application type. However, there are several key metrics that IT teams should keep an eye on when measuring performance
- Request rate
- Latency rate
- Error rate
- Memory/CPU utilization
These last two can be gathered in several ways, such as from cloud provider dashboards. The more complex the application environment across a hybrid architecture, the more features an IT team needs for observability.
Learn more in our detailed guide to application monitoring in aws
Application Observability Use Cases
Application observability is important for the work of DevOps teams, site reliability engineers, and CloudOps teams.
DevOps
DevOps teams enhance the performance, reliability, and speed of application development and deployment processes. They leverage application observability tools and practices to ensure continuous integration and delivery (CI/CD) pipelines are optimized and that any issues can be quickly identified and resolved. For DevOps, application observability facilitates:
- Rapid problem identification and resolution: By integrating observability tools into the CI/CD pipeline, DevOps teams can detect and diagnose issues early in the development cycle.
- Performance optimization: Observability allows DevOps teams to monitor application performance. By analyzing metrics, logs, and traces, they can identify bottlenecks and inefficiencies within the application or infrastructure.
- Enhanced collaboration: Application observability tools provide a unified view of application health and performance, which is accessible to both development and operations teams. This shared visibility fosters collaboration, as teams can work together to troubleshoot issues and implement improvements.
- Feedback loop for continuous improvement: Observability provides valuable insights into how applications perform in real-world scenarios. DevOps teams use this information to continuously refine their development practices, architecture choices, and deployment strategies.
Site Reliability Engineers
Site Reliability Engineers (SREs) are tasked with ensuring that application services are reliable, scalable, and efficiently operated. Application observability enables the following SRE functions:
- Service Level Objective (SLO) management: SREs rely on observability to monitor and measure the performance of services against predefined SLOs. This enables them to proactively identify and address service level agreement (SLA) violations before they impact end-users.
- Incident management and response: Through real-time monitoring and alerting capabilities provided by observability tools, SREs can quickly respond to incidents. They utilize detailed telemetry data to pinpoint the root cause of issues, reducing mean time to resolution (MTTR) and improving system reliability.
- Capacity planning and resource optimization: Observability data helps SREs understand application resource consumption patterns. This insight is critical for capacity planning, ensuring that resources are allocated efficiently and scaled appropriately.
- Risk management and reliability engineering: By analyzing trends and patterns in observability data, SREs can identify potential risks to application reliability. This allows them to engineer resilience into the system, minimizing the likelihood of disruptions.
CloudOps
CloudOps teams are responsible for managing cloud-based infrastructure and operations, and application observability helps them navigate the complexities of cloud environments. Observability aids CloudOps in:
- Cloud resource monitoring: Observability tools enable CloudOps teams to monitor the health and performance of cloud resources. This includes virtual machines, containers, serverless functions, and managed services.
- Cost management and optimization: By providing insights into resource utilization and application performance, observability helps CloudOps teams identify opportunities for cost savings. This could involve scaling down underutilized resources or adopting more cost-effective cloud services.
- Security and compliance: By continuously monitoring cloud environments, CloudOps can detect and respond to security threats in real-time, while also ensuring compliance with regulatory standards.
- Hybrid and multi-cloud management: As organizations adopt hybrid and multi-cloud strategies, observability allows CloudOps teams to maintain visibility across diverse cloud platforms.
Types of Application Observability Tools
There are many application observability tools available today that are designed for different business needs. While the following three types of tools are the most predominant, end-to-end observability platforms will often include vital aspects of all three.
Application Performance Monitoring (APM) Tools
APM tools track application components affecting end-user experiences like peak usage load and response times. They also track capacity fluctuations in compute resources and the locations of bottlenecks based on established baselines.
Distributed Tracing Tools
Distributed tracing tools track application requests flowing between frontend devices and backend services/databases. Developers can use these tools to find requests with high latency or errors. This is particularly useful in complex cloud-native applications that use containers and microservices.
Log Management Tools
Log management tools gather, archive, and interpret logs from applications and systems. At their core, logs are textual records of events, errors, and vital data regarding a system or application. These solutions allow developers and operations personnel to sift through logs, establish occurrence-specific alerts, and discern trends.
While APM, tracing, and log management tools have their individual limitations, they can collectively deliver on application observability best practices.
AIOps Tools
AIOps tools leverage artificial intelligence (AI) and machine learning (ML) to automate the analysis of data from IT operations tools and devices. They are designed to handle massive volumes of data in real time, enabling IT teams to identify and resolve issues faster than traditional methods allow.
AIOps can predict problems before they impact the business, optimize system performance, and automate routine practices. They are particularly effective in complex environments where the sheer scale and dynamics could overwhelm human operators.
Incident Response Tools
Incident response tools allow organizations to efficiently manage and mitigate issues as they occur within their applications and infrastructure. They help in coordinating the response to incidents, ensuring that they are identified quickly and addressed according to predefined workflows.
Incident response tools provide dashboards and reporting capabilities to track incident metrics, facilitating continuous improvement in how organizations respond to and recover from incidents. Features often include alerting mechanisms, escalation paths, and collaboration platforms for teams to work together on resolving issues.
Data Correlation Tools
Data correlation tools support application observability by aggregating and analyzing data from multiple sources across the application stack to identify patterns, anomalies, and root causes of issues. They sift through the noise to find meaningful insights within the large amounts of telemetry data generated by modern applications.
By correlating data across logs, metrics, and traces, these tools provide a comprehensive view of application behavior and performance, helping teams to diagnose and resolve issues more efficiently. Advanced data correlation tools can leverage AI and machine learning to predict potential issues and optimize performance proactively.
Challenges in Application Observability
There are several barriers to achieving effective observability over applications.
Data Silos
When data is isolated within different departments or systems without a seamless way to integrate and interact, it becomes difficult to gain a unified view of the application landscape. This fragmentation can lead to inefficiencies in identifying and resolving issues, as well as missed opportunities for optimizing performance across the entire system.
Complexity
The complexity of modern application environments, with their mix of cloud, microservices, containers, and serverless architectures, adds a significant layer of difficulty to achieving observability. The dynamic and distributed nature of these environments can make it challenging to track and monitor application behavior and performance.
Resistance to Change
Adopting new tools and methodologies often requires changes in culture, processes, and skill sets. Organizations may face challenges in motivating teams to embrace these changes and in training staff to effectively use new observability tools and techniques. Overcoming this resistance is crucial for organizations to enhance their operational resilience and agility.
Cost
The expenses associated with acquiring advanced observability tools, integrating them into existing environments, and training personnel can be significant. Organizations must also consider the ongoing costs of processing, storing, and analyzing large volumes of data. Balancing these costs with the benefits of improved reliability and performance is crucial.
Best Practices for Application Observability
Standardize Data Collection and Logging
Standardizing data collection and logging across your application stack is critical for enhancing application observability. By establishing uniform logging formats and collection practices, teams can ensure that data from various parts of the application is comparable and easy to aggregate.
This uniformity aids in quickly pinpointing the root cause of issues, as it removes the variability and confusion that come with interpreting data from different sources or formats. Additionally, standardized logging makes it easier to automate analysis processes, since the data is predictable and structured. This approach also facilitates better integration with observability tools, enabling them to process and display information more efficiently and accurately.
Maximize Contextualization
Contextualization involves enriching observability data with relevant contextual information to make it more actionable. This means linking data to specific application versions, user sessions, or transaction paths to provide a clearer understanding of its impact.
By adding context, teams can more easily prioritize issues based on their actual or potential impact on the user experience or business operations. Contextualization helps in converting raw data into insights that drive decision-making. For instance, understanding that a spike in error rates coincides with a new feature rollout allows for quicker diagnosis and response.
Implement Distributed, Context-Rich Tracing
Implementing distributed, context-rich tracing is crucial in complex, microservices-based architectures. This practice involves tagging and tracking every request as it traverses through the various services and components of an application. By attaching detailed context to each trace, such as user identifiers, service names, and operation details, teams can gain deep insights into the flow and performance of transactions across the system.
This level of detail is invaluable for troubleshooting issues, understanding system dependencies, and optimizing performance. Distributed tracing, when done correctly, breaks down the intricacies of service interactions, helping teams to identify bottlenecks and failures in the application flow.
Establish a Continuous Feedback Loop and Automated Anomaly Detection
Organizations need to set up observability as a continuous feedback loop that enables DevOps and SRE professionals to fully connect observability with business outcomes. The first step to doing this is to integrate KPIs that use automated workflows and anomaly detection with monitoring, reporting, and alerting.
This enables DevOps and SRE professionals to see and respond to the same data. They can then add external feedback from end users and even customers to improve the data and KPIs by seeing if anomaly remediation has changed received alerts and customer feedback.
A continuous feedback loop supports the enhanced detection of unknown anomalies while reducing alert fatigue and improving application performance and uptime.
Achieving Application Observability with Faddom Application Mapping
Organizations that lead in observability are seeing an ROI of 86%, while those just starting out on their application observability journeys have reported an ROI of 64%, according to Splunk. While there are many application observability tools and platforms available, every enterprise should focus on the best approach to total visibility and detection via a streamlined and refined alerting process. This will support real-time detection and remediation across a complex hybrid cloud environment.
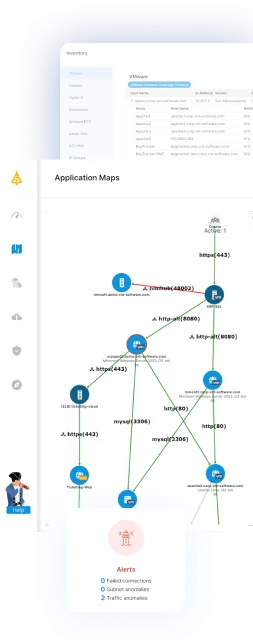
Faddom can enhance contextual insights, root cause analysis, alerts, and much more to integrate with and improve observability tools. See it in action! Start your free trial today by simply filling out the form in the sidebar.


