

How IT Mapping Works
IT mapping is a process that involves creating a visual representation of an organization’s IT infrastructure, including hardware, software, applications, and data flows. Here are the steps involved in how IT mapping works:
1. Inventory assets: The first step in IT mapping is to inventory all IT assets, including hardware devices, software applications, and data sources. This includes identifying the location, specification, and configuration of each asset.
2. Identify relationships: Once the inventory is complete, the relationships between IT assets must be identified. This includes data flows, connections, and dependencies between different parts of the system.
Related content: Read our guide to IT system mapping
3. Create visualizations: With the assets and relationships identified, the IT environment can be visualized using diagrams or other visual representations. This includes depicting hardware and software components, data flows, and connections between different parts of the system.
4. Document details: The IT mapping process also involves documenting the IT environment, including specifications, configurations, and other important details about each asset. This documentation can be used for reference and to support IT decision-making.
Learn more in our detailed guide to check SSL certificates
5. Analyze and optimize: With the IT environment documented and visualized, it is possible to analyze the infrastructure to identify areas for optimization or improvement. This includes identifying inefficiencies, redundancies, or security vulnerabilities. Based on the analysis, IT mapping can inform IT planning and decision-making.
6. Update and maintain: IT mapping is an ongoing process that requires updating and maintenance to remain accurate and relevant. As the IT environment evolves, IT mapping must be updated to reflect changes in hardware, software, and data flows.
IT Mapping Challenges for Digital Organizations
IT infrastructure and application mapping is a process for discovering and understanding every application and device, along with their dependencies and services across an organization’s entire digital footprint. With a basic understanding of the broad nature of application dependency mapping, organizations can look at these challenges within and across all environments.
Cloud Migration
Nearly every organization has some applications and workloads in the cloud or has upcoming plans in place to do so. According to Nutanix research, 91% of surveyed enterprises migrated at least one application in the last year.
Learn more in our detailed guide to vmware aria operations for networks
On-premises and cloud applications will need to maintain their dependencies to databases, workloads, and other applications after a migration to avoid scenarios where they stop working. The lack of proper application dependency mapping can lead to the disruption or breaking of these dependencies, which can exist across bare metal, virtual servers, and cloud providers, in any migration process. These needs make it vital to have a clear view of every dependency when planning and executing a migration.
Related content: Read our guide to network visibility
Disaster Recovery and Microsegmentation
BCDR strategies keep an organization operational in the wake of cybersecurity attacks that get inside the network (such as ransomware) or natural disasters. This approach is often a major reason for cloud migration and data center transformation (via a hybrid-cloud model mix of on-premises and cloud).
An organization must identify all dependencies and migrate them together to ensure proper disaster recovery. If not, the whole point of backups is moot since they lose ongoing application updates and dependencies without ongoing application mapping.
Microsegmentation is an important way to protect the network from attacks by separating environments, applications, workloads, VMs, and users to apply least privilege access policies to data/workflows based on compliance needs. Without a clear understanding of application and IT infrastructure using comprehensive mapping, it becomes impossible to protect these different areas, applications, and workflows.
Related content: Read our guide to microsegmentation guide
Data Center Transformation
Organizations can easily lose track of dependencies between applications, devices, and IT infrastructure that grows in complexity inside their data center, the cloud, and beyond the network’s edge. These environments and connections are changing daily in the modern organization where IT documentation and assessment are critical to keeping data, devices, applications, and workflows moving and secure.
While there are several methods that organizations have historically used to map applications and IT infrastructure, they all have their pros and cons. To understand why they each may have blind spots that make comprehensive and real-time mapping challenging, it’s best to start by looking at the different approaches in use today.
Application Mapping Approaches: Pros and Cons
Since the emergence of ITSM and ITAM, organizations have understood how imperative it is to keep track of IT infrastructure, devices, applications, services, and their dependencies.
1. Cloud Provider and IT Mapping Tools
Even in the current cloud era, which is always changing, the three largest providers—AWS, GCP, and Azure—all have service discovery tools for mapping application resources.
Pros
These tools can play a vital role in understanding the state of all cloud resources to help limit cloud spend, improve developer productivity, and increase application availability among others.
Cons
In a hybrid multi-cloud world, underlying dependencies can stretch across on-premises data centers and multiple clouds and providers. These mapping tools can often be relegated to silos (by design) that prevent a holistic view and create unmanageable complexity in the mapping process.
Related content: Read our guide to snmp
2. CMDB Mapping
There are many types and configurations of the configuration management database (CMDB) in use across countless organizations. It ideally acts as a repository for storing all information and dependencies related to all IT assets, which are known as configuration items (CI). CIs include hardware, devices, software, and networks, along with their performance, configuration, location, financial, licensing, and maintenance data.
Pros
When a CMDB provides a complete picture of an organization’s assets, it helps the business make better IT decisions through problem resolution, incident response, and updates for networks and infrastructure. Other benefits include planning for business strategy, budgets, and regulatory compliance. The primary challenge with a CMDB is keeping it updated. This plays out in many ways that limit the CMDB as a single source of truth for IT assets across every environment.
Cons
Most IT teams struggle to maintain an accurate CMDB for a variety of reasons, but mostly because IT environments on-premises and in the cloud are constantly changing. Many CMDBs cannot respond to the pace of DevOps or virtual assets like VMs, containers, and other cloud application resources. Others still require manual data entry validation and manual audits to stay up to date with new CI configurations and dependency changes.
Related content: Read our guide to check ssl certificates
Although modern CMBDs include application mapping, they often only collect data based on a specific request. They also can have limited ability to see all changes in dependencies and services and provide root cause analysis within that request. This leads to a limited snapshot-in-time view of an application and some of its dependencies without providing the ability to see if it’s operating correctly and delivering the required service level.
3. Application Performance Management (APM)
APM provides real-time application performance monitoring across an organization’s application portfolio. APM enables a view into service level agreement compliance, performance level, and user challenge identification.
Pros
An APM solution’s diagnostics should give administrators insights into problems within the application stack to plan proactive remediation. These real-time performance alerts and reports generated by the APM are vital to maximizing business revenue, continuity, efficient operation, cost reductions, and end-user experience.
Cons
APM tools require the installation of an agent for targeted infrastructure or applications. The result is that organizations cannot effectively use these tools with new applications and VMs that are spun up and down, or third-party enterprise applications like SAP, as just one example.
The agent-based nature of APM tools creates silos, with gaps in data on application efficiencies across environments, including on-premises and the cloud or multi-cloud. This makes it impossible to see real-time application performance with detailed knowledge across dependencies, in turn making root cause analysis nearly impossible.
4. Application Dependency Mapping (ADM)
The Application Dependency Mapping (ADM) process identifies all IT and application elements and services across an organization’s IT environment. ADM provides a means of seeing how these elements work together and individually in real time to assess health and proactively make improvements. Most ADM tools work without agents and use various methods for finding application dependencies in real time. This supports the dynamic nature of application development where applications and infrastructure can change daily.
Pros
The right ADM tool can provide the most combined benefits of the solutions covered in this blog. CMDBs currently exist and serve ongoing and unique purposes in many organizations, and some organizations already have an existing APM. In these cases, the ideal ADM can work with these solutions and a world of third-party tools in the enterprise.
Cons
As a mapping tool category, ADM has few downsides, but many of these tools fall short in their ability to provide real-time, repeatable, and comprehensive mapping across environments. The different approaches used by ADM solution providers can deliver different results based on a narrower basis for environment mapping.
This can lead to an incomplete picture of the entire IT infrastructure, its applications, and their dependencies where environmental changes are continuous. The ideal scenario is an ADM tool that captures the state and relationships of all assets across every environment in real time without slowing performance via easily repeatable passive scanning.
Notable IT Mapping Tools
Application Dependency Mapping (ADM) and Observability Tools
1. Faddom
![]()
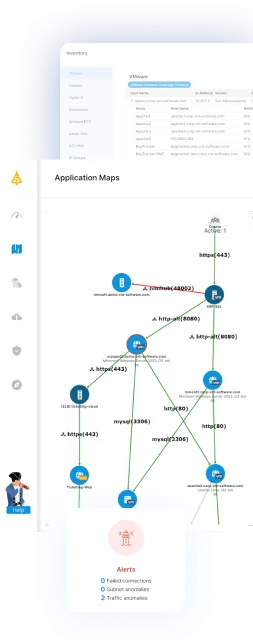
Faddom is an agentless application dependency mapping (ADM) platform that builds a real-time map of servers, applications, and their dependencies across on-premises, cloud, and hybrid environments. It works by analyzing a copy of network traffic rather than installing software on each server, and it automatically groups discovered servers into business applications. Because it does not require agents, credentials, or firewall changes and can run offline, it stays read-only and keeps all data inside the customer’s environment. The platform applies AI-driven correlation on top of the raw traffic to turn it into application and dependency context. A first map can typically appear within about an hour of deployment, and it supports use cases spanning discovery, change management, migration, cost optimization, audit and compliance, and security.

Key features include:
- Agentless passive discovery: Faddom maps the environment by analyzing a copy of network traffic rather than installing agents on each server. This means it needs no server credentials and no firewall changes, and it adds no overhead to the systems it is observing.
- Real-time application and dependency mapping: It continuously discovers servers and automatically groups them into business applications. The map updates 24/7 as the environment changes, so it reflects the current state rather than a single point-in-time snapshot.
- Hybrid and multi-cloud coverage: It connects to multiple data sources and virtualization platforms, such as VMware and Azure, to map on-premises and cloud workloads together in one view. This includes visibility into east-west traffic between systems across the environment.
- Change management and migration support: Faddom tracks changes over time and supports wave-based migration planning. This helps teams see which dependencies must move together and understand the impact of a change before it is made.
- Security and compliance context: A set of “secure” capabilities tracks SSL/TLS certificates, surfaces external network connections, and flags software weaknesses such as outdated components. This supports segmentation, audits, and reduction of the attack surface.
- Documentation and reporting: It maintains an auto-updating inventory and dependency documentation that can support internal governance and external audits, replacing manual spreadsheets with a continuously updated source of truth.
Limitations (as reported by users on G2):
- Reporting and export refinement: Some users would like more polished report exports and dashboards, noting that certain export views and on-screen working areas for fields could be roomier or more configurable.
- Initial learning investment: Because the platform is feature-rich, some users note that its terminology and breadth of capabilities take time to learn and that it delivers the most value with regular, ongoing use.
- Map readability at scale: In very large or highly complex environments, a few users mention that dependency maps can become busy and that some layouts benefit from manual tidying.
2. Dynatrace
![]()
Dynatrace is an observability platform that brings application, infrastructure, log, and security monitoring together with AI-driven analysis. It ingests many data types—traces, metrics, logs, events, topology, and more—and stores them in a data lakehouse called Grail for analytics at scale. A single deployed component, OneAgent, collects metrics across the application-delivery chain, while PurePath captures code-level distributed traces end to end. Its Smartscape capability automatically identifies and maps the relationships between applications and the underlying infrastructure in real time, and that map is then used to add context to the collected data. Deterministic AI is applied for anomaly detection, prediction, and root-cause analysis across the stack.

Source: Dynatrace
Key features include:
- Smartscape topology mapping: Dynatrace automatically identifies and maps interactions and relationships between applications and the underlying infrastructure in real time. It uses that live map to enrich and contextualize the data it collects.
- OneAgent data collection: A single agent deployed on a host continuously collects relevant metrics across the full application-delivery chain. This reduces the need to instrument each component individually.
- PurePath distributed tracing: It captures timing and code-level context for distributed traces, end to end, across the full stack. This supports detailed analysis of where time is spent in a transaction.
- AI-driven analysis: Deterministic AI is used for anomaly detection, prediction, and root-cause analysis. The aim is to point toward a cause rather than only flagging symptoms.
- Grail data lakehouse and OpenPipeline: Data of any type from any source is ingested, enriched, and stored in a schema-on-read lakehouse for fast analytics. Stream processing through OpenPipeline pre-processes and contextualizes incoming data.
- Broad solution coverage and integrations: It spans infrastructure, application, log, digital experience, and application security use cases. It integrates with major cloud platforms, containers, and enterprise technologies.
Limitations (as reported by users on G2):
- Cost: Reviewers frequently describe Dynatrace as one of the more expensive options on the market, which can be a barrier for smaller organizations.
- Learning curve: Several users report that it takes significant training and time for teams to become proficient, and that the platform can feel complex at first.
- Dashboard customization effort: Some reviewers note that getting custom business dashboards to behave exactly as wanted can require substantial manual configuration
3. Splunk AppDynamics

Splunk AppDynamics (formerly AppDynamics, now part of Splunk’s observability portfolio under Cisco) is an application performance monitoring (APM) platform for hybrid and on-premises applications. It automatically discovers business transactions and builds a topology map of how traffic flows through an application in real time, establishing performance baselines and triggering diagnostics when transactions deviate from them. It works with languages such as Java, .NET, Node.js, PHP, Python, and C/C++, and extends to infrastructure monitoring, digital experience monitoring, network monitoring, and application security. Machine learning is used for automatic anomaly detection and root-cause analysis. It is available as SaaS, on-premises, and as a self-contained virtual appliance.

Source: Cisco
Key features include:
- Application performance monitoring: It identifies hybrid and on-prem application issues in real time and helps diagnose the root cause across the stack, from third-party APIs and the network down to the code level.
- Business transaction monitoring and baselining: AppDynamics automatically discovers business transactions, maps how traffic flows through applications, and learns performance baselines. It can then trigger diagnostic actions when key transactions slow down.
- AI-driven anomaly detection and root-cause analysis: Machine learning detects when transactions perform abnormally without preconfiguration and surfaces suspected causes. Operators can confirm or rule these out, then drill into metrics and snapshots.
- Full-stack and infrastructure monitoring: It extends beyond application code to infrastructure monitoring across traditional and cloud-native environments. It also covers digital experience monitoring (real-user and synthetic) and network monitoring via the ThousandEyes integration.
- Application security and SAP monitoring: A Secure Application add-on provides vulnerability and threat detection with business context. A dedicated SAP solution pinpoints issues down to a line of ABAP code or a specific database query.
- Flexible deployment and log integration: It is available as SaaS, on-premises, or a Kubernetes-based virtual appliance. Log Observer Connect links AppDynamics APM context with Splunk log analytics without duplicating data.
Limitations (as reported by users on G2):
- Steep learning curve: Reviewers note that configuring the tool initially can be difficult and that it often requires training to understand its features fully.
- Information-dense interface: Some users find the interface can feel overwhelming with many data points, and that navigating to a specific option within the dashboard can be hard.
- Support responsiveness: A few users report occasional delays in customer support response times.
Network and Infrastructure Mapping Tools
4. SolarWinds Network Topology Mapper
![]()
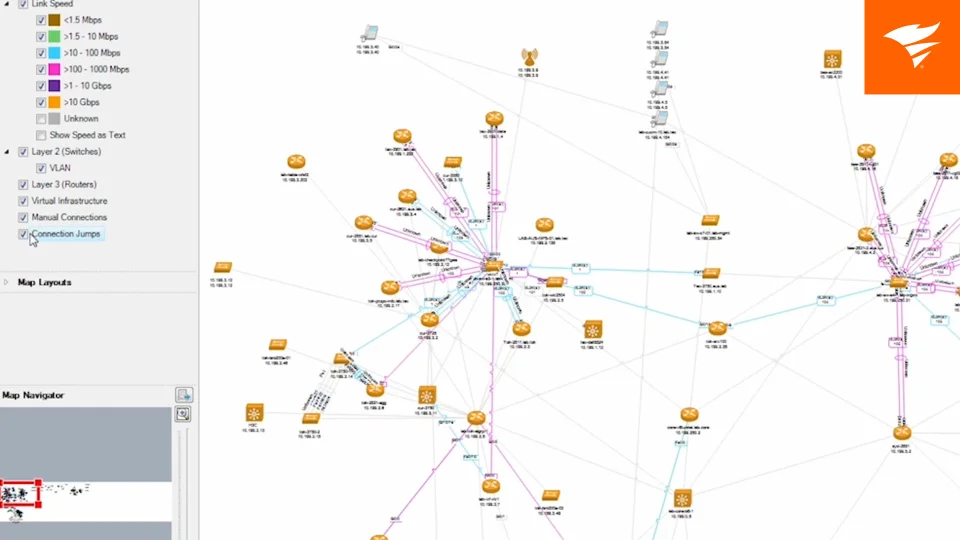
SolarWinds Network Topology Mapper (NTM) is network mapping software that automatically discovers devices and plots logical network diagrams. Its autodiscovery uses multiple methods—ICMP, SNMP, WMI, CDP, VMware, and Microsoft Hyper-V—to perform multi-level discovery and produce integrated OSI Layer 2 and Layer 3 maps with detailed device information. Maps can be generated in minutes from an IP address range or a seed device, and scheduled scanning keeps them current by detecting new or changed devices. Diagrams export to Microsoft Visio, PDF, and PNG, with the option to schedule updated exports. The software also performs hardware inventory and report generation to help meet compliance requirements.

Source: SolarWinds
Key features include:
- Automated multi-method discovery: NTM discovers devices across the network using ICMP, SNMP, WMI, CDP, VMware, and Hyper-V. It can scan IP address ranges or start from a seed device to map the environment.
- Layer 2 and Layer 3 topology mapping: It performs multi-level discovery to produce integrated OSI Layer 2 and Layer 3 maps. These show switch-to-switch, switch-to-node, and switch-to-router connections with device detail.
- Scheduled scanning and change detection: Scheduled network scans automatically detect new devices and changes to the topology. This keeps maps current without the need to manually rescan repeatedly.
- Map export and documentation: Maps export to Microsoft Office Visio, PDF, and PNG, with Visio SmartShapes populated from discovery data. Exports can also be scheduled to Orion Network Atlas.
- Network inventory and reporting: It performs hardware inventory management and automates report creation. Reports can cover switch ports, VLANs, subnets, and device inventory.
- Compliance support: Up-to-date network maps and reports help address requirements such as PCI, SOX, HIPAA, and FIPS 140-2 that call for current network documentation.
Limitations (as reported by users on TrustRadius):
- Limited advanced functionality: Reviewers note that it can lack some advanced features and may require ongoing care in very large environments.
- Performance on large networks: Some users report slow initial scans, and that scanning and map updates can slow down in large or complex networks.
- Windows-only and manual map adjustments: It runs only on Windows, and users note that generated maps often need manual tweaks to position objects as desired.
5. ManageEngine OpManager
![]()
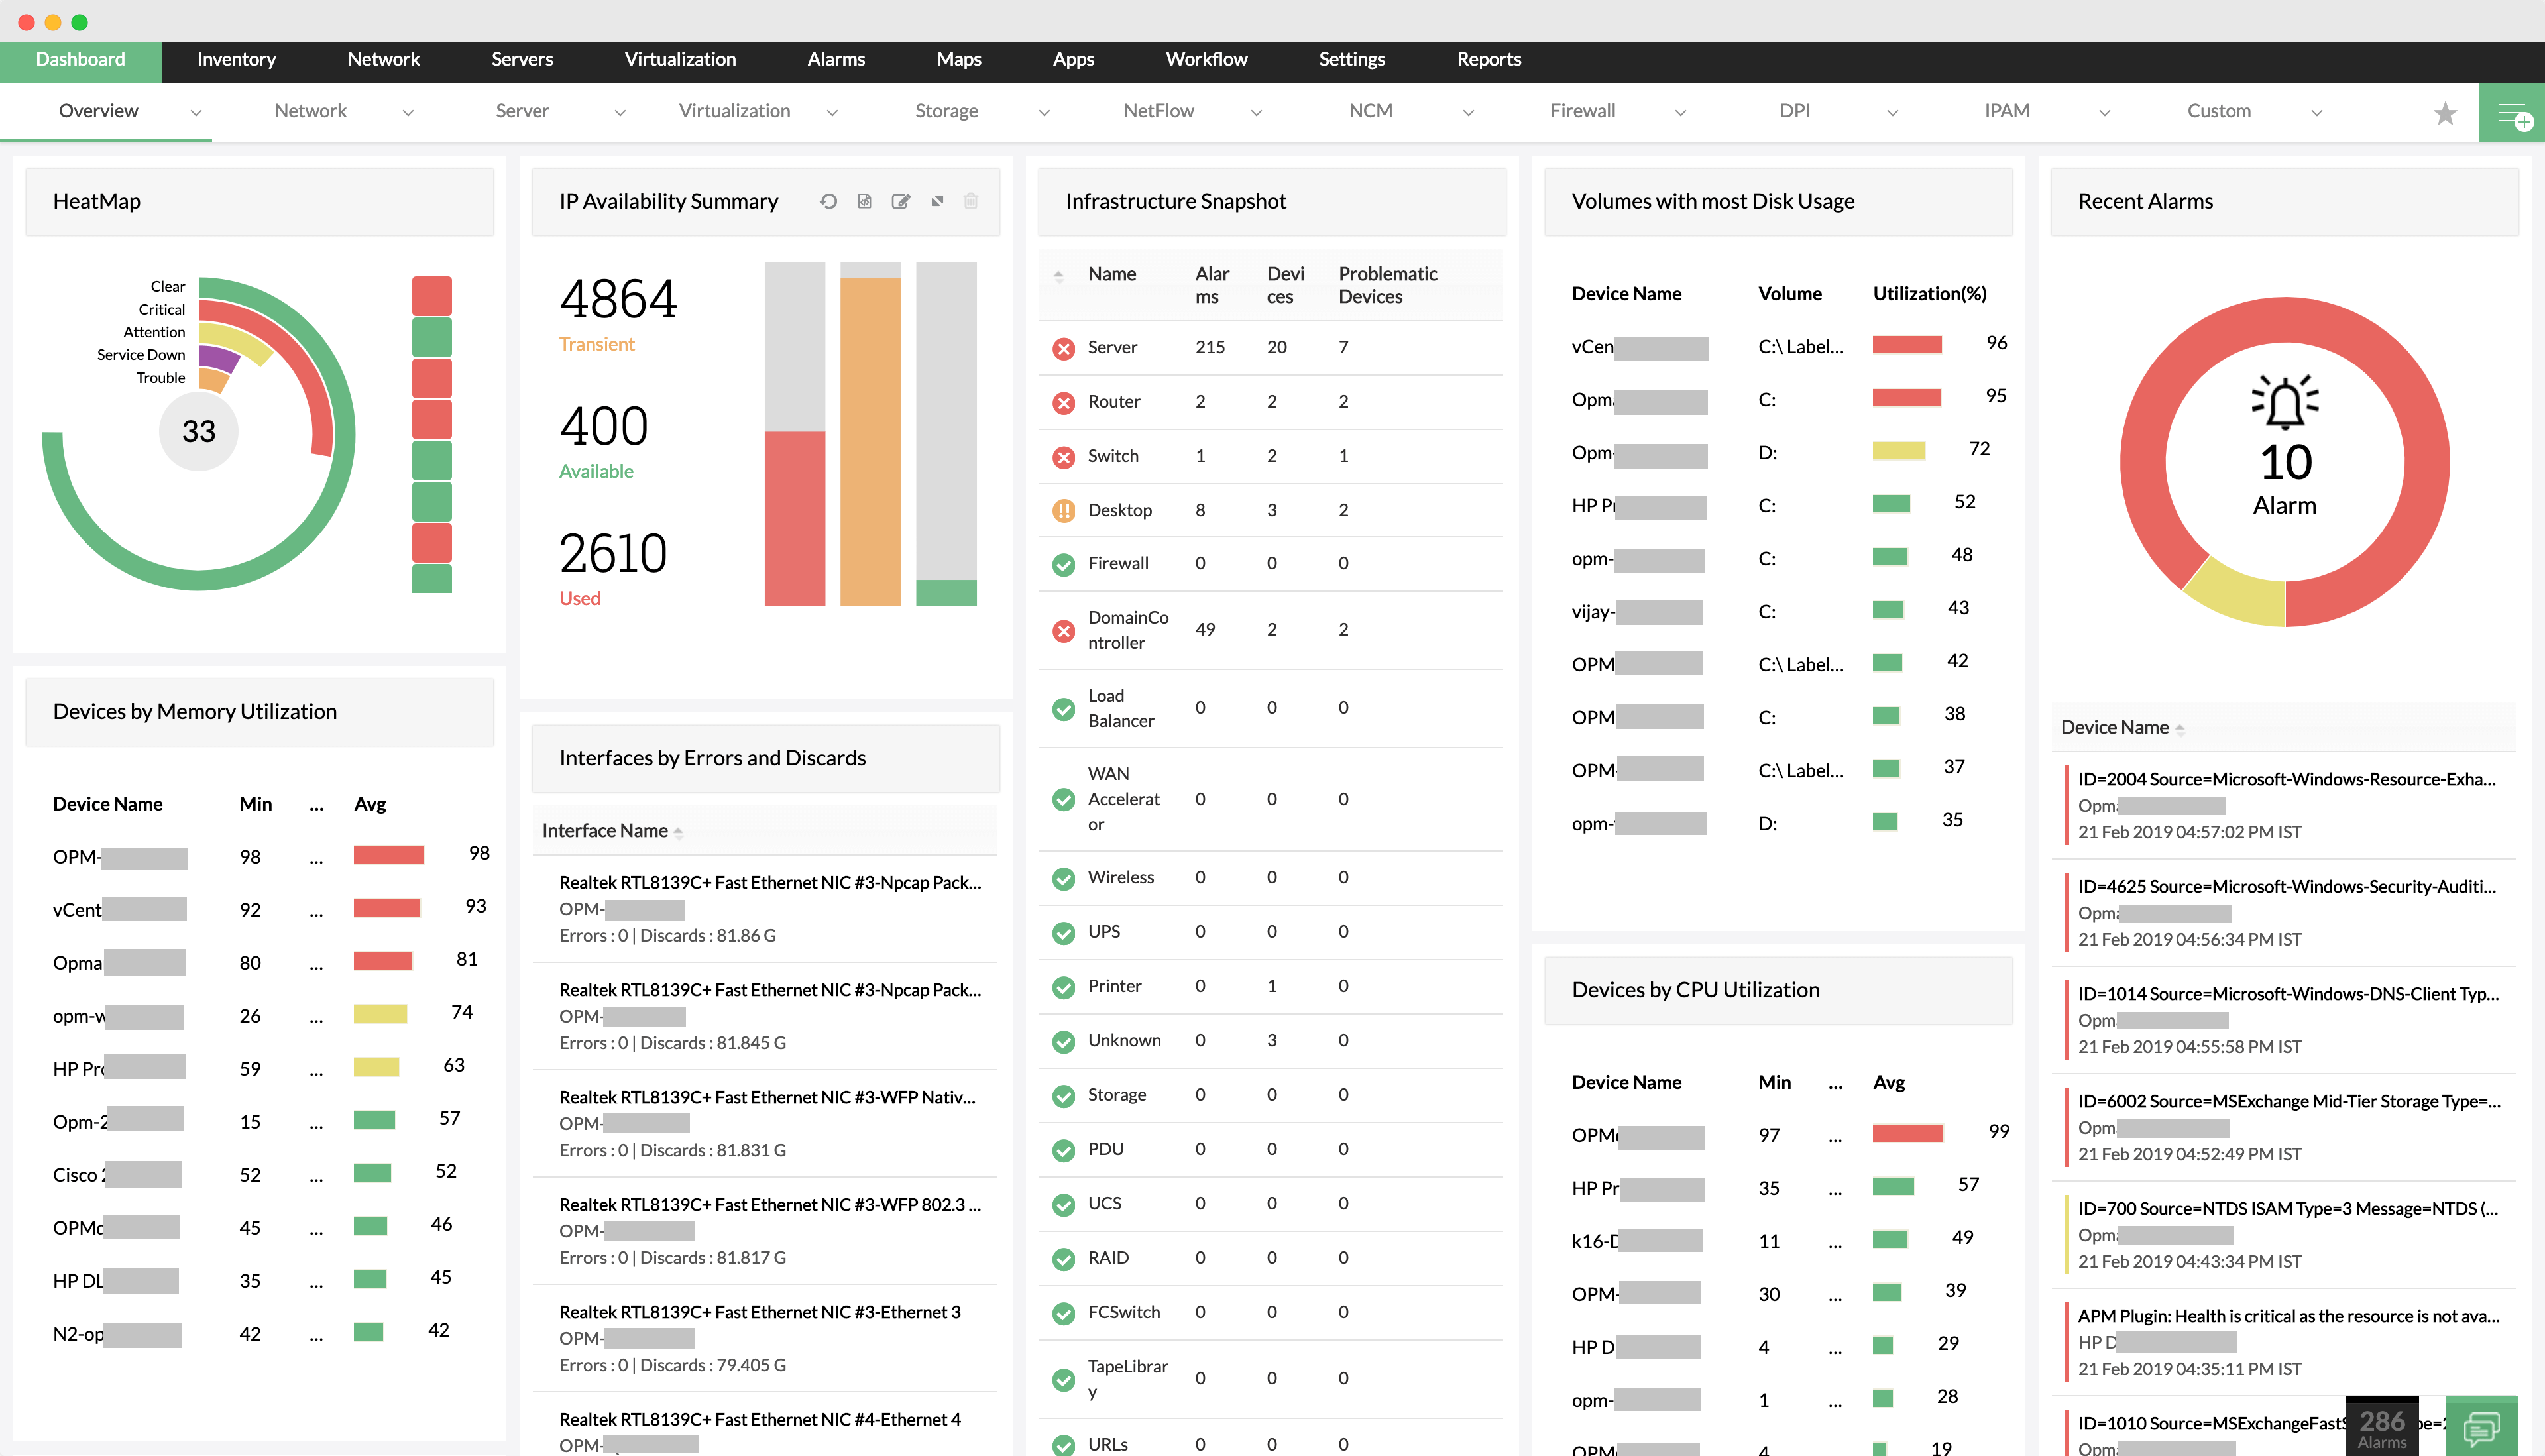
ManageEngine OpManager is network, server, and storage performance monitoring software that also provides network visualization. It monitors devices such as routers, switches, firewalls, load balancers, wireless LAN controllers, servers, VMs, printers, and storage, and lets administrators drill down to the root cause of an issue. For visualization it offers Layer 2 maps, virtual topology maps, Business Views, and 3D floor and rack views for data centers. Its fault management correlates raw events, filters out noise, and presents color-coded alarms classified by severity, with notifications by email and SMS. It also discovers Cisco ACI infrastructure and supports workflow automation and AIOps-oriented features in higher editions.

Source: ManageEngine
Key features include:
- Multi-device performance monitoring: OpManager monitors routers, switches, firewalls, load balancers, wireless LAN controllers, servers, VMs, printers, and storage devices. This gives visibility into performance and availability from a single console.
- Network visualization: It provides Layer 2 maps, virtual topology maps, Business Views, and 3D floor and rack views. Teams can build representations of data center floors and drill into a device snapshot page when faults occur.
- Fault management and alerting: It correlates raw network events, filters out unwanted ones, and presents color-coded alarms classified by severity. Staff can be notified by email and SMS so issues are addressed before users report them.
- Root-cause analysis: Administrators can drill down into problematic areas of the network to identify and resolve the source of an issue quickly.
- Cisco ACI and storage monitoring: It discovers Cisco ACI infrastructure, including fabric, tenants, and endpoint groups, and monitors storage devices alongside the rest of the environment.
- Workflow automation and dashboards: Custom, user-specific dashboards and Business Views are available, along with workflow automation and AIOps-enabled features in higher editions.
Limitations (as reported by users on G2):
- Complex initial setup: Reviewers note that setup and advanced configuration can be complex, particularly in large networks.
- Performance and interface at scale: Some users report occasional performance slowdowns with large numbers of devices, and feel the interface looks somewhat dated compared with newer tools.
- Licensing and reporting limits: Several note that some advanced features require additional licensing, and that reporting and customization could be more flexible and user-friendly.
6. NetBrain

NetBrain is a network automation and mapping platform focused on visibility and automated troubleshooting across hybrid network environments. It instantly creates documentation, hybrid-cloud maps, A-to-B path views, and inventory reports, and it can overlay third-party data on those maps. It continuously assesses networks to flag risks and support compliance, and it uses automation to analyze change impact and guard against configuration drift. Map-based, AI-assisted diagnosis can be triggered automatically to investigate issues and close noisy tickets. The platform integrates with tools such as ServiceNow, Splunk, SolarWinds, Datadog, Infoblox, Jira, and ThousandEyes.

Source: NetBrain
Key features include:
- Hybrid-cloud visibility and mapping: NetBrain creates dynamic, map-based views of hybrid-cloud and SDN environments, including live, historic, and “golden” path analysis. It can overlay third-party data and export documentation from these maps.
- Automated discovery and documentation: It generates network maps, documentation, and inventory reports automatically. This reduces the manual effort needed to keep network records current.
- AI diagnosis and automated troubleshooting: Triggered auto-diagnosis uses AI to investigate issues, auto-close noisy tickets, and surface transient problems. The goal is to reduce escalations and time to resolution.
- Continuous assessment and compliance: It assesses networks around the clock to identify risks and support compliance, including a dedicated focus on requirements such as DORA.
- Change management with impact analysis: It analyzes change impact at each stage, defines test plans, executes changes, and adds rules to guard against configuration drift.
- Integration and extensibility: It integrates with platforms including ServiceNow, Splunk, SolarWinds, Datadog, Infoblox, Jira, and ThousandEyes to bring external data into its workflows.
Limitations (as reported by users on Gartner Peer Insights):
- Setup and learning curve: Reviewers note that initial setup, configuration, and onboarding take time and expertise, and that the newer intent-based automation features have a steep learning curve, especially in large environments.
- Licensing cost and complexity: Some users describe the modular, per-device licensing as expensive to scale and complex, particularly for smaller teams.
- Infrastructure resource demands: Continuous discovery, mapping, and data collection can require substantial server, storage, and bandwidth resources in large deployments.
IT Asset and Configuration Mapping Tools
7. ServiceNow CMDB
![]()
ServiceNow CMDB is a configuration management database that acts as a central system of record for configuration item (CI) data across the enterprise. It consolidates data from multiple IT systems through certified Service Graph Connectors to give a 360-degree view, and it can populate and refresh that data automatically. It assesses data accuracy on an ongoing basis to keep the repository trustworthy, and it provides visualization and reporting that show business context and technical CI relationships on a unified map. Because it is part of the broader ServiceNow platform, CMDB data feeds into adjacent processes such as IT service management and governance, risk, and compliance.

Source: ServiceNow
Key features include:
- Single system of record: ServiceNow CMDB stores configuration item data in one place and shares it across the enterprise. This helps teams work from consistent, accurate information rather than separate copies.
- Service Graph Connectors: Certified connectors integrate data from multiple IT systems to provide a 360-degree view. This is intended to break down silos between separate product data sources.
- Automated data population: It populates and refreshes CI context automatically so teams can understand risk and impact. This reduces reliance on manual data entry.
- Data accuracy and governance: It continuously assesses data accuracy and supports auditing of data sets. The aim is to keep the CMDB a trusted foundation for automation and reporting.
- Relationship visualization and reporting: It presents business context and technical CI relationships on a comprehensive unified map. Reports help teams understand the context of their infrastructure.
- Platform integration: As part of the ServiceNow platform, CMDB data connects with adjacent processes such as IT service management and governance, risk, and compliance.
Limitations (as reported by users on PeerSpot):
- Complex implementation: Reviewers note that initial setup and configuration are complex and time-consuming, often depending on experienced internal resources or outside consulting.
- Ongoing data upkeep: Keeping the CMDB clean and accurate requires continuous effort; without it, data can become outdated, and custom processes are often needed to remove stale records.
- Cost and licensing: Users point to high licensing and implementation costs, with automated CMDB population (discovery) typically requiring a separately licensed module.
8. Lansweeper

Lansweeper is an asset discovery and inventory platform that provides a unified view of assets across IT, OT, cloud, and IoT environments. It discovers and inventories hardware, software, and users in depth, then normalizes that data into a single, trusted view. It enriches assets with context, relationships, and risk and lifecycle signals so teams can assess risk, forecast spend, and surface optimization opportunities. The resulting asset intelligence can be delivered to ITSM, CMDB, and security tools so that downstream actions are accurate and scoped. Accurate, current asset classification also serves as a foundation for Zero Trust and network segmentation.

Source: Lansweeper
Key features include:
- In-depth asset discovery: Lansweeper discovers and inventories assets across IT, OT, cloud, and IoT environments. It captures hardware, software, and user details, including previously unmanaged or unknown devices.
- Unified, normalized inventory: It normalizes data from across the technology estate into a single, consistent view. This gives teams one source of asset truth rather than fragmented records.
- Context and risk enrichment: It enriches assets with relationships, vulnerability data, and lifecycle signals. This helps teams assess risk, forecast spend, and identify optimization opportunities.
- Integration with ITSM, CMDB, and security tools: It delivers trusted asset data to ITSM, CMDB, and security platforms. The goal is that actions taken in those tools are accurate, scoped, and prioritized.
- Continuous validation: It keeps the asset view continuously validated and current. Both IT and security teams can then act on the same data.
- Segmentation and Zero Trust foundation: Accurate, current asset classification provides the verified foundation needed to enforce access and segmentation policies.
Limitations (as reported by users on G2):
- Support access: A recurring theme is that customer support can be hard to reach directly, with interaction often limited to chat or web forums rather than real-time help.
- Interface and configuration: Some users find the interface can be overwhelming for newcomers, and that locating or changing certain configuration settings is not always intuitive.
- Reporting performance: A few reviewers note that loading or running larger reports can be slower than ideal, even on well-resourced servers.
9. Freshworks
![]()
Freshservice, from Freshworks, is an AI-powered IT service management (ITSM) platform that unifies service, asset, and operations management in one place. Its IT asset management tracks hardware, software, and cloud tools in real time within an auto-updating CMDB, bringing asset visibility, relationships, and service context together. Its IT operations management adds end-to-end visibility, intelligent alerting, and faster resolution. Freddy AI agents can understand requests and take action across workflows, supporting ticket deflection through self-service. Overall, the platform aims to replace disconnected tools with a single system for service delivery, asset context, and automation.

Source: Freshworks
Key features include:
- IT asset management with CMDB: Freshservice automatically tracks hardware, software, and cloud tools in an auto-updating CMDB. This brings asset visibility, relationships, and service context together in one place.
- IT operations management: It provides end-to-end visibility with intelligent alerts and faster resolutions. This is intended to streamline day-to-day IT operations.
- AI agents and automation: Freddy AI agents understand requests and act across workflows, and can be deployed across channels with governance. They support ticket deflection through AI-powered self-service.
- Unified service delivery: It unifies service, asset, and operations management on one platform. This replaces disconnected tools and is meant to reduce administrative overhead.
- Workflow orchestration: Built-in workflows reduce setup effort and can be extended with customizable orchestration as needs evolve.
- Service management beyond IT: As a unified service management platform, it can extend service delivery to non-IT teams across the organization.
Limitations (as reported by users on G2):
- Reporting depth: Reviewers note that out-of-the-box reporting is limited, and that building custom reports for non-standard data can require workarounds.
- Advanced automation limits: Some users find that more complex workflow automation can be difficult to configure or constrained by the available options.
- Configuration and pricing: A few note that advanced customizations and integrations can be complex to set up initially, and that some functionality sits in higher-tier plans.
Defining the Ideal ADM Tool for IT Mapping
The critical nature of IT mapping is a foundational process that enables any organization to operate, change, and grow while being secure, resilient, and profitable. If there are four words that define the needs of any tool for an organization in the digital age, they would likely be comprehensive, fast, agile, and simple. These apply to IT mapping as well.
Comprehensive
When seeking the ideal ADM tool, it must first be comprehensive so that it maps all IT infrastructure, applications, dependencies, and services across all environments in real time. It must be capable of predicting change via integrated analytics to differentiate between various topologies as it audits changes.
Related content: Read our guide to network topology mapping
Comprehensive alerts should bolster this analysis to pinpoint performance and functionality challenges. The same level of reporting will enable proactive corrective action and business planning for everything from cloud migration and data center transformation to BCDR, security, access, and change management.
Related content: Read our guide to vmware networking basics
Speed and Agility
An ideal mapping tool must have a very fast and easily repeatable process, which requires a great deal of automation and visibility via a single dashboard. The resulting transparency and agility enable both pre- and post-migration mapping and automatic discovery of anything with an IP address to plan long-term hybrid multi-cloud strategies. It can also track the constant changes in the app development lifecycle (including containers, microservices, and API endpoints) and virtualized environments.
Simplicity
The simplicity, repeatability, and speed of the ideal ADM tool enable a consistent real-time view of the global environment. It also makes the resulting data easily available to IT and the business to maximize operational efficiency and innovation. It’s imperative that the tool provide visibility across all networks on the application layer in real time.
Related content: Read our guide to network address translation
This delivers critical data for microsegmentation that fosters maximum security and a zero-trust model for user and app access to thwart cyberattacks. Finally, the ideal ADM tool will do all this while integrating with existing third-party tools and never affecting performance so that the organization always operates with the highest efficiency.
How Faddom Helps With IT Mapping
IT mapping is no longer a static documentation exercise but a continuous, real-time requirement for managing modern hybrid environments. As infrastructure becomes more dynamic, traditional approaches like manual mapping, siloed cloud tools, or outdated CMDB data struggle to provide the accuracy and visibility needed for effective decision-making, risk management, and operational efficiency.
A real-time, automated approach to application dependency mapping is essential to maintain control, especially for initiatives like cloud migration, data center transformation, and cybersecurity. Faddom enables organizations to achieve this by delivering continuous, accurate visibility into dependencies across their entire environment, helping teams reduce risk, improve performance, and operate with confidence in an increasingly complex IT landscape.
IT Documentation
Authored by Faddom
- [Guide] IT Documentation: 9 Standards and Best Practices
- [Guide] Network Documentation: What to Document & 4 Best Practices
- [Product] Faddom | Instant Application Dependency Mapping Tool
ITOM
Authored by Faddom
- [Guide] What Is IT Operations Management (ITOM)? Functions, Tools & Tips
- [Guide] ITOM vs. ITSM: Differences, Similarities & Using Them Together
- [Product] Resource and Cost Optimization with Faddom
Data Security
Authored by Cloudian


