What Is IBM Turbonomic?
IBM Turbonomic is an IT automation platform that improves performance and cost-efficiency of IT infrastructure. Using intelligent automation, it continuously ensures optimal allocation of compute, storage, and network resources without manual intervention. The platform carries out real-time optimization actions that adjust resource distribution based on current application demand.
Turbonomic supports public, private, and hybrid clouds, including major providers like AWS, Azure, and Google Cloud, along with Kubernetes and traditional data center infrastructure.
IBM Turbonomic Limitations
Turbonomic has some potential drawbacks that may prompt some organizations to consider alternatives. These limitations were shared by users on the G2 platform.
Frequent Release Cycles and Support Delays
Turbonomic is subject to frequent release cycles, and this creates challenges in keeping up with new versions, changes, and features. This can also contribute to delay in support responses. The influx of inquiries following each release strains IBM support teams, potentially leading to longer wait times for resolution.
Scheduling and Scalability Challenges
Some users find the task of scheduling resources to match changing demands complex, especially in large-scale environments. This complexity stems from the need to balance operational requirements with available resources.
In addition, scalability issues arise as organizations attempt to expand their infrastructure within Turbonomic’s ecosystem. It can be difficult to maintain performance and cost-efficiency during rapid expansion or unexpected spikes in demand.
Limited Integrations
Users report challenges in connecting Turbonomic with other tools and platforms within their IT ecosystems. The lack of integrations can impede workflow automation and data sharing across different systems, leading to inefficiencies and manual workarounds.
Need for Customization
Users often express the need for more flexible customization options that allow them to adjust the platform’s behavior and settings in line with their operational requirements. Tubonomics often takes the approach of a one-size-fits-all solution and does not support specialized requirements.
IBM Turbonomic Competitors and Alternatives
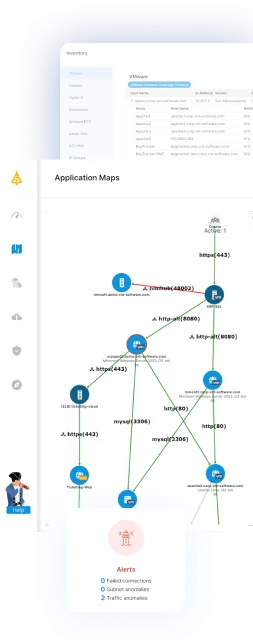
1. Faddom

Faddom offers a unique approach to IT infrastructure optimization by mapping the entire IT ecosystem into business applications it supports. This helps IT teams identify underutilized resources and optimize costs without automatic resource allocation.
Key features:
- Agentless mapping: Completes infrastructure mapping within an hour without requiring credentials, ensuring security and ease of deployment.
- Business application mapping: Provides detailed visualizations of IT assets and their relationships to business applications, aiding in precise resource management.
- Cost optimization: Identifies underused servers and resources, helping to reduce operational costs efficiently.
- Lightweight deployment: Its lightweight nature ensures minimal disruption to existing systems during setup.
- Affordable pricing: Starts at $10K/year, making it accessible for organizations of various sizes.
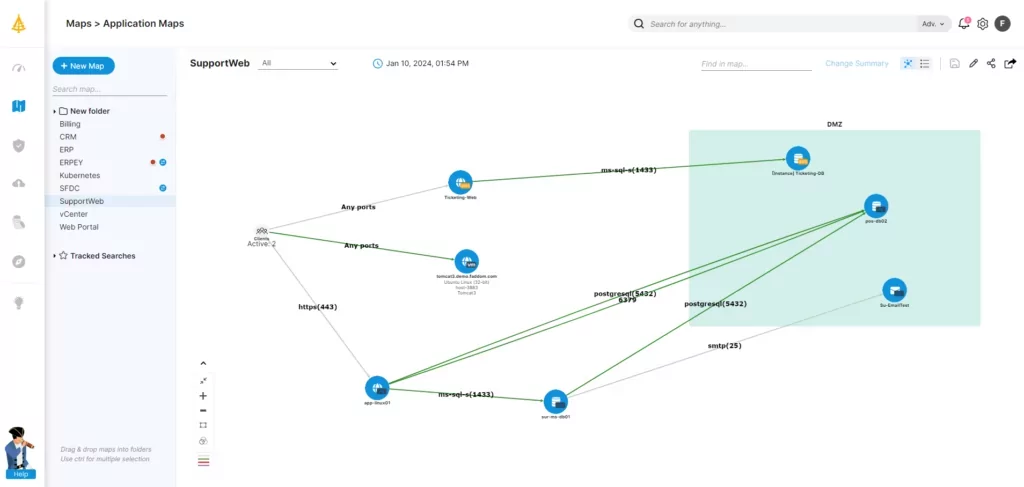
Source: Faddom
2. ServiceNow
ServiceNow Service Mapping is an IT service management (ITSM) platform, offering solutions for automating IT operations and improving efficiency. By centralizing the management of IT services, ServiceNow supports operations, incident resolution, and streamlined IT processes.
Key features:
- Automated incident management: Reduces response times by automating the incident management process and minimizing disruptions to services.
- Change and release management: Provides tools for planning, implementing, and tracking changes in IT infrastructure, ensuring minimal risk and impact on operations.
- Asset and configuration management: Maintains a database of IT assets and their configurations, aiding in management and optimization of resources.
- Performance analytics: Offers analytics tools to monitor performance, identify trends, and make data-driven decisions for continual service improvement.
- Self-service portal: Enables users to request services, report issues, and track the status of their incidents or requests autonomously.
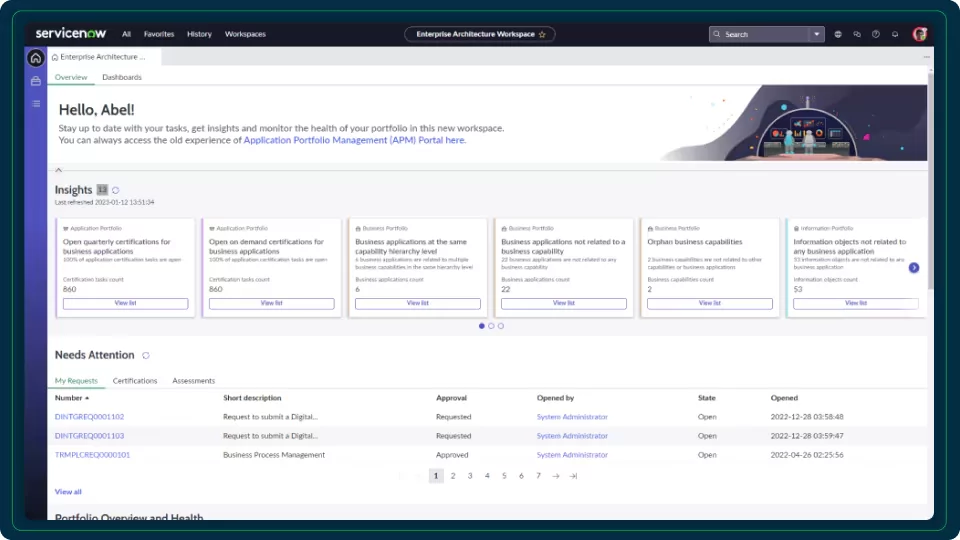
Source: Servicenow
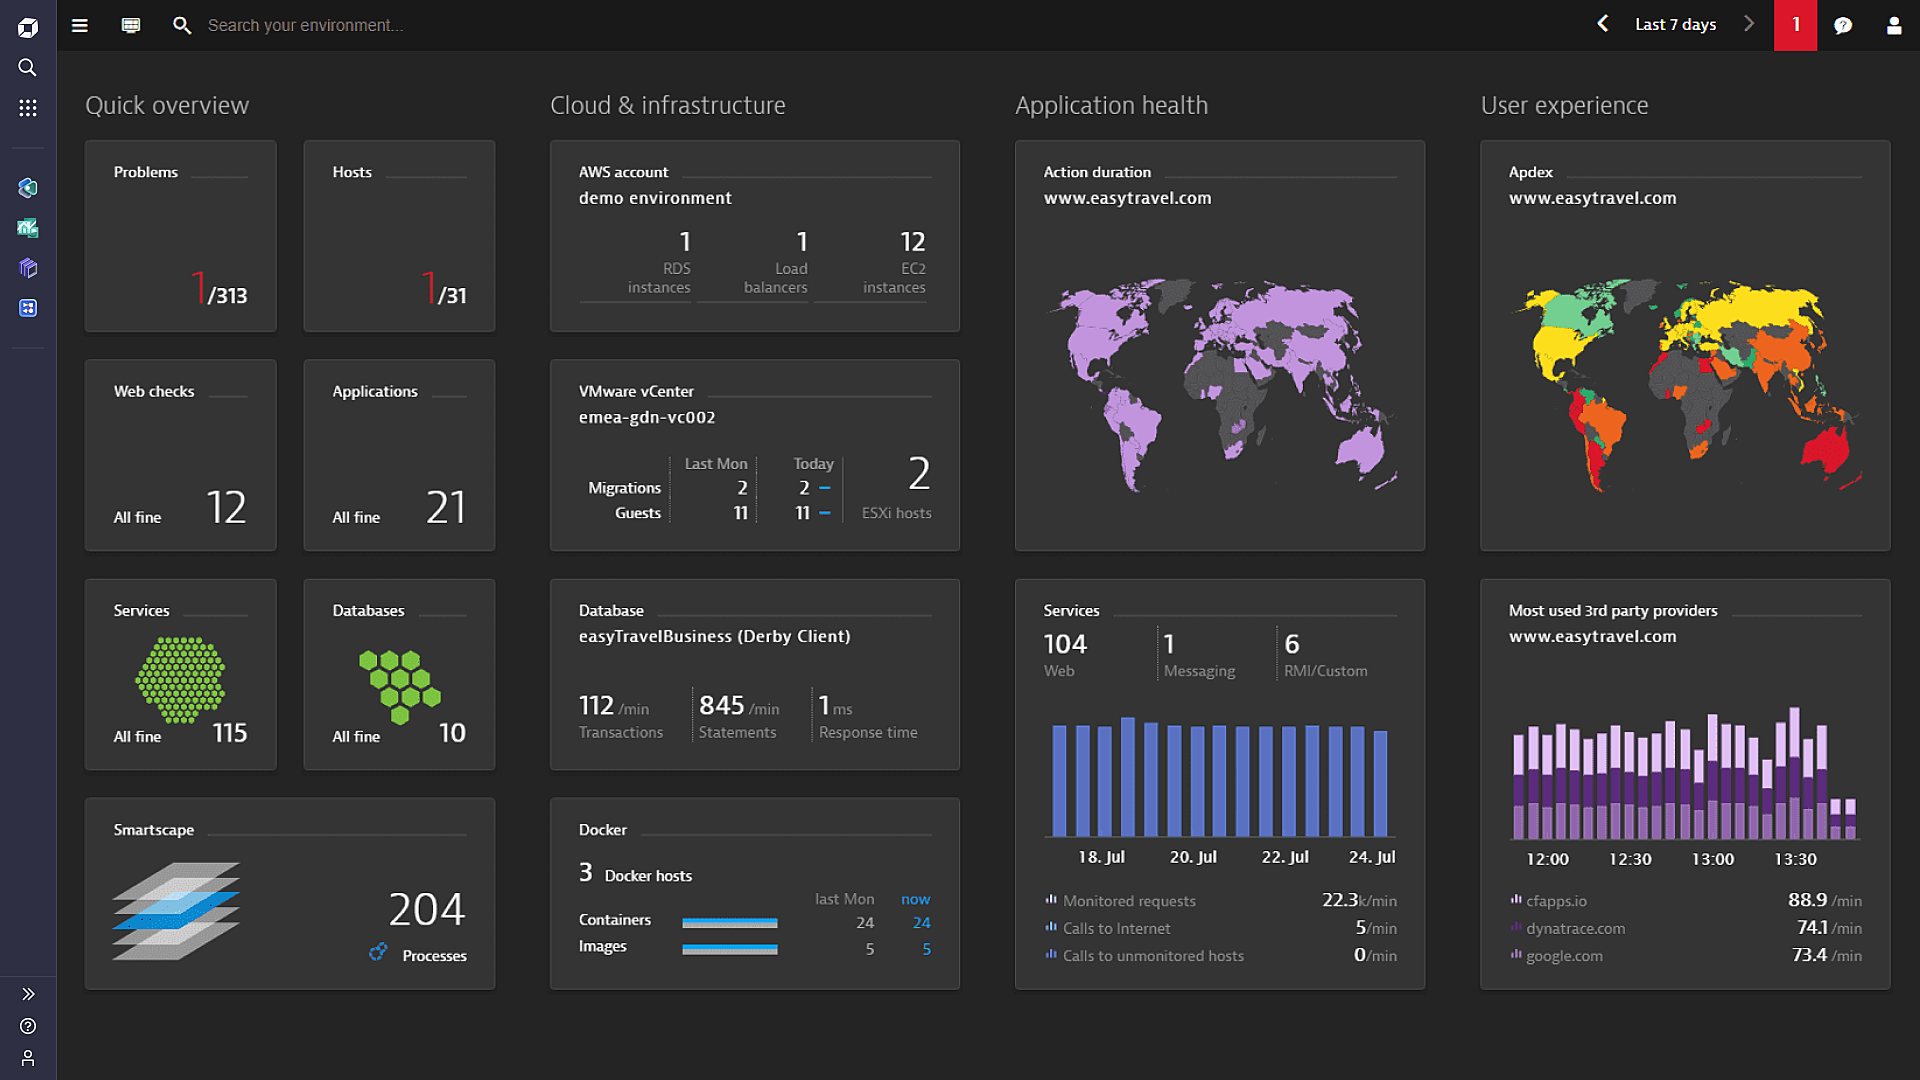
3. Dynatrace
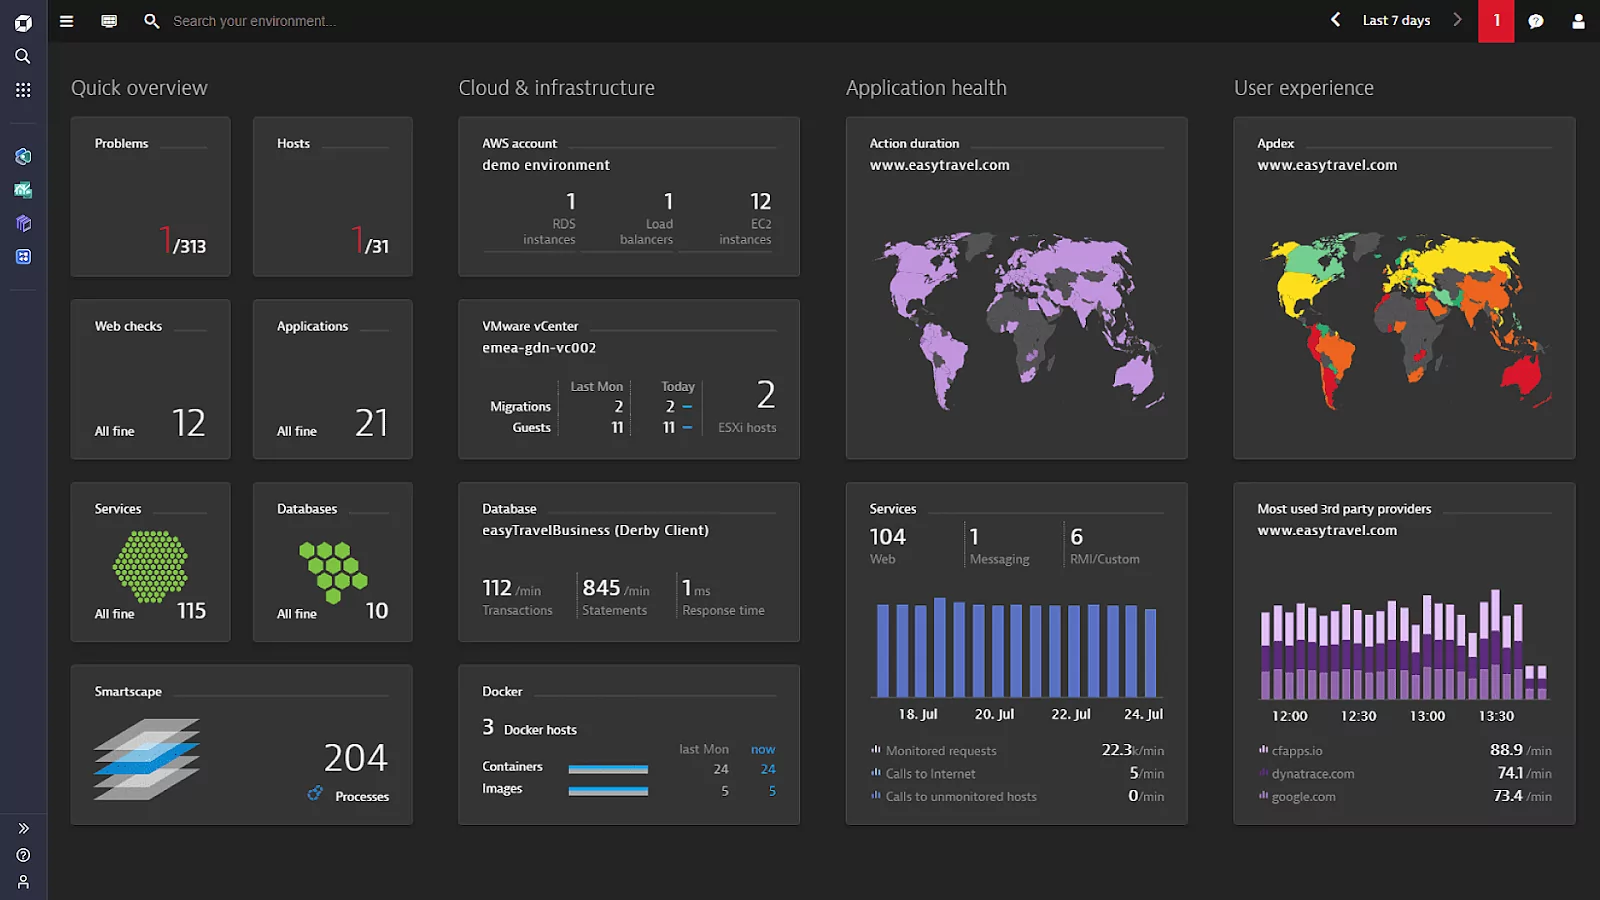
Dynatrace offers an infrastructure monitoring and observability platform designed for hybrid and cloud environments. It leverages AI to provide insights across the entire IT landscape, automating the discovery and visualization of dynamic infrastructure. It helps eliminate monitoring gaps, promotes collaboration, and enhances efficiency through unified analytics.
Key features:
- AI-powered insights: Uses an AI engine, Davis, to deliver insights that can boost team productivity, reduce major outages and degradations, and cut mean time to recovery.
- Automated contextualization: Automatically contextualizes ingested data for analytics and AI-driven root cause analysis without manual tagging or event correlation.
- Kubernetes observability: Offers specialized capabilities for Kubernetes environments, including health monitoring, resource consumption analysis, application performance tracking, and microservice dependency mapping with automated full-stack analysis.
- Automation engine integration: Integrates with automation platforms for auto-remediation, automatic ticketing, and real-time CMDB updates to facilitate incident management around the clock.
- Log monitoring with Grail: Provides log monitoring powered by Grail for maximum data context fidelity at minimized cost and effort.
Source: Dynatrace
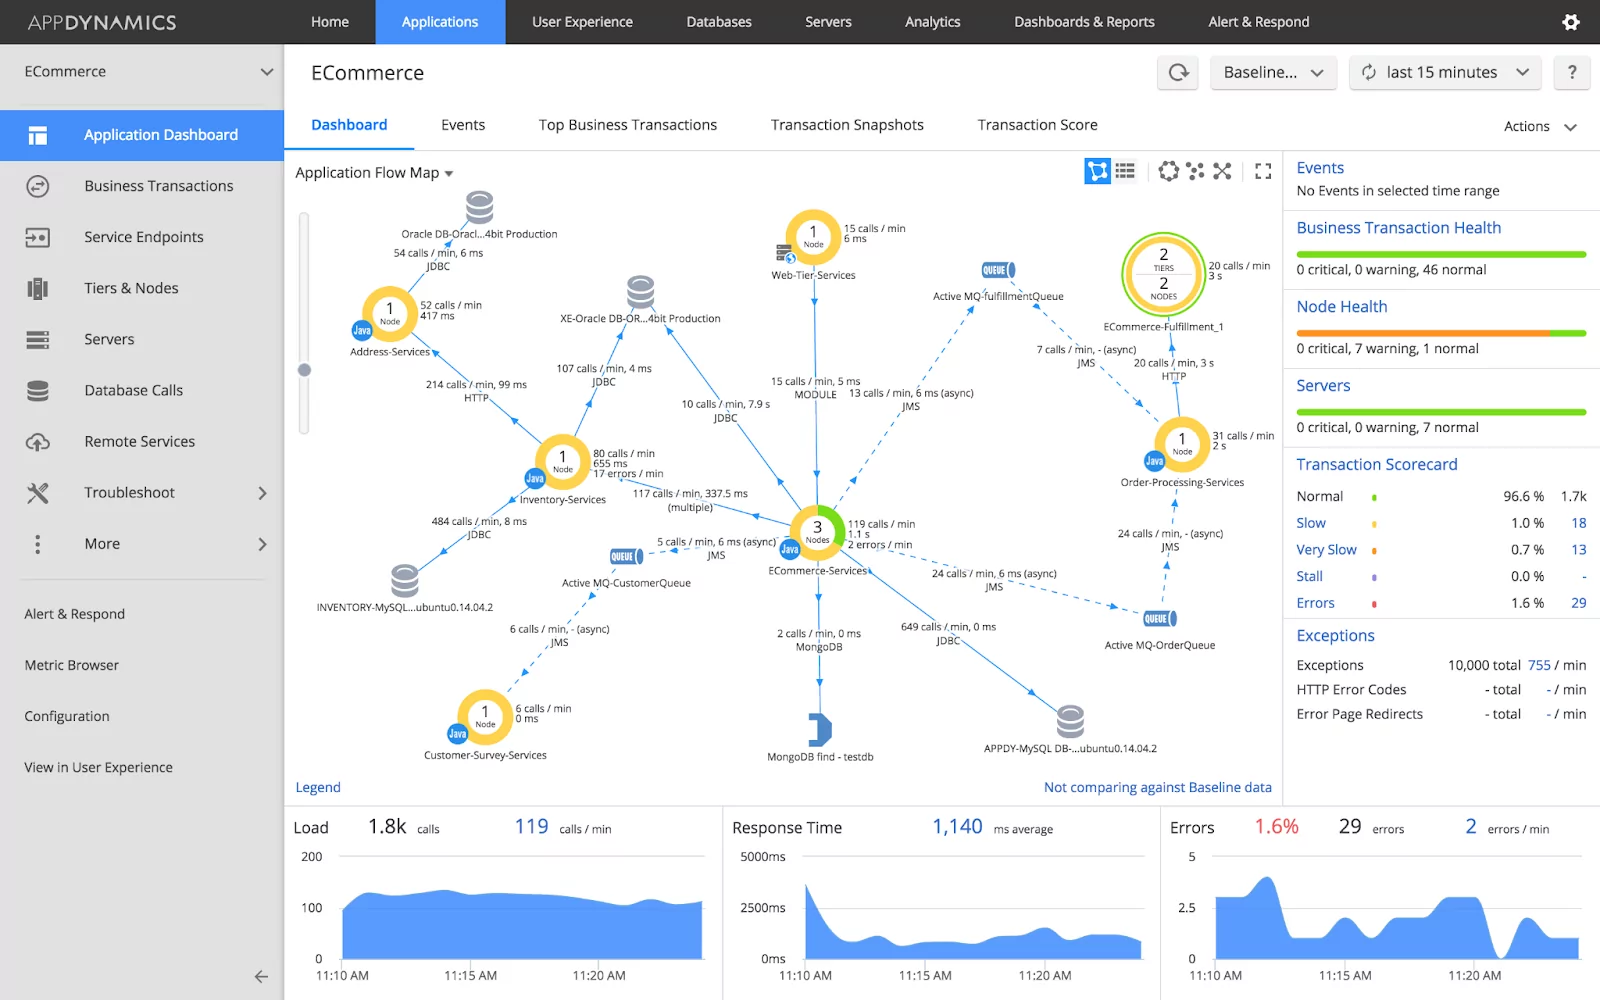
4. AppDynamics
AppDynamics is an application performance management (APM) and IT operations analytics tool designed to monitor, manage, and optimize complex software environments. It offers a suite for managing user experience and operational efficiency.
Key features:
- Business performance monitoring: Links application performance to business outcomes, allowing teams to prioritize actions based on their impact on the bottom line.
- End-to-end user monitoring: Provides tools for visualizing user experiences across applications, identifying issues that affect customer satisfaction.
- Application diagnostics: Enables quick identification and resolution of application issues by pinpointing root causes down to the code level in real-time.
- Infrastructure visibility: Offers visibility into infrastructure components supporting applications, including servers, databases, and cloud services, for optimal performance.
- Network performance insights: Helps isolate problems across networks and third-party services that could affect application performance or user experience.
- Integrated security: Automates the detection of security vulnerabilities within applications, facilitating swift remediation to protect against threats.
Source: AppDynamics
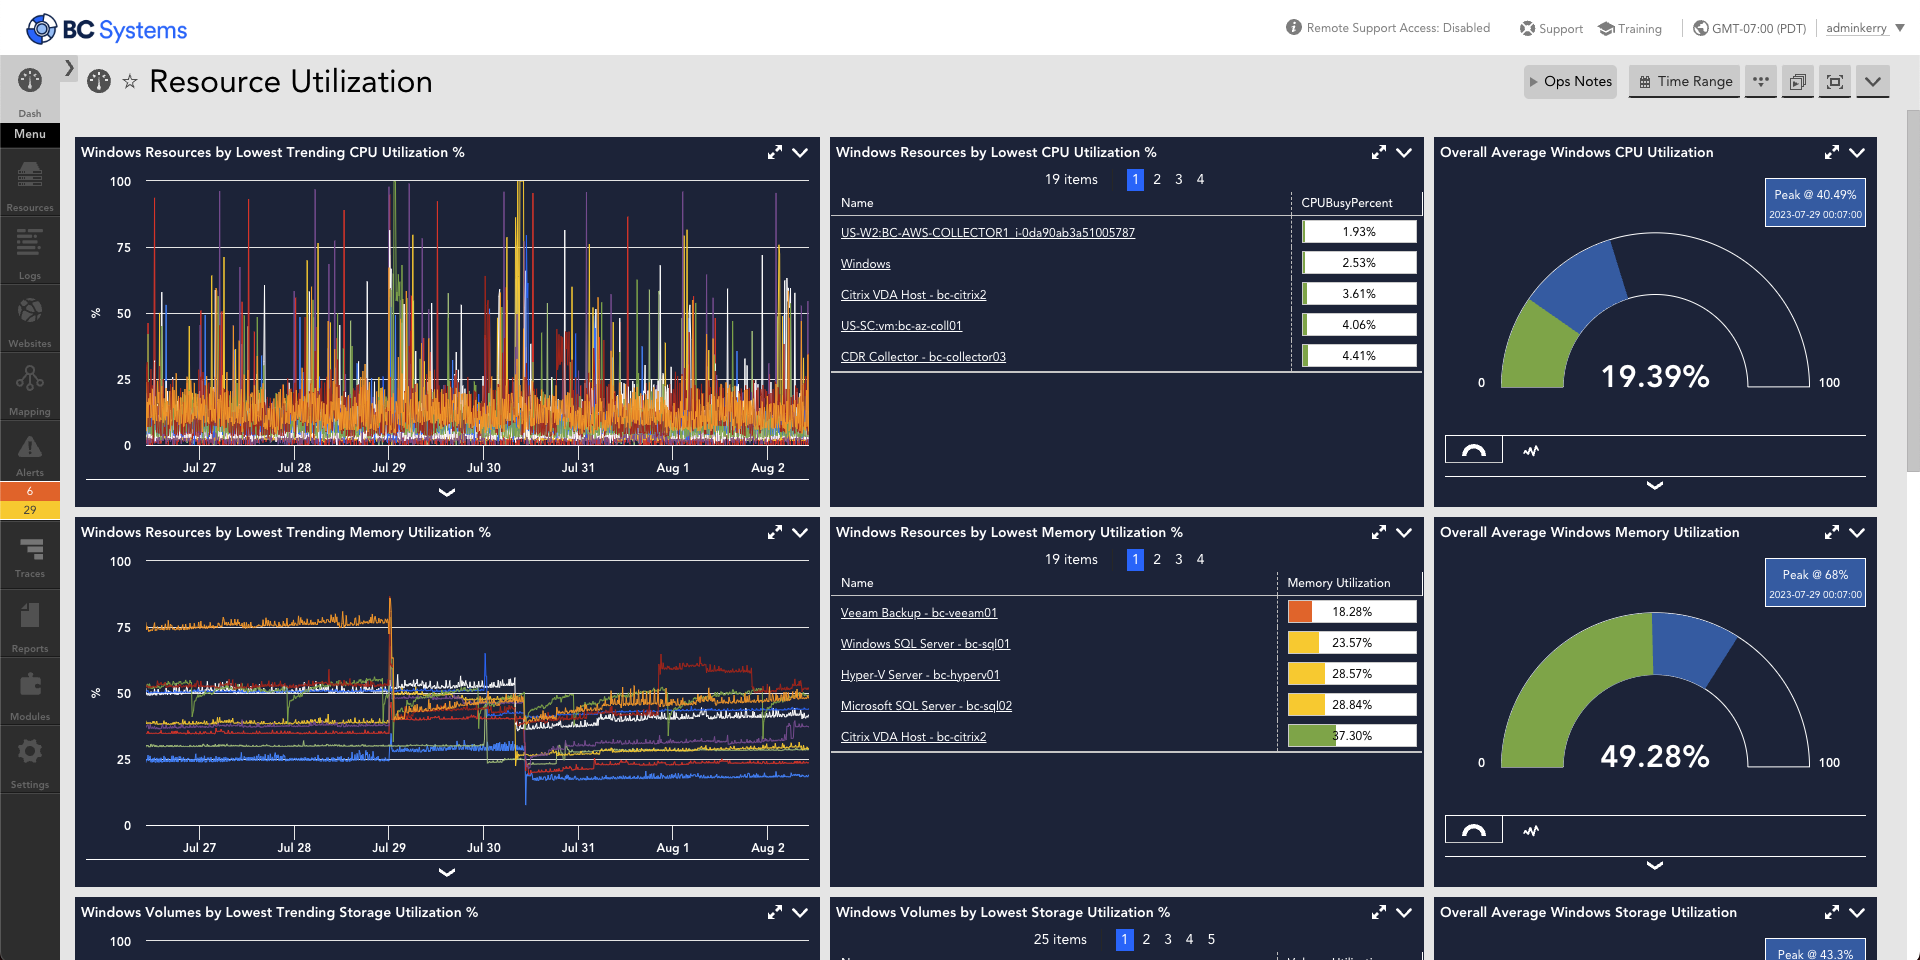
5. LogicMonitor

LogicMonitor is a cloud-based infrastructure monitoring solution that provides visibility into network, server, and cloud environments. It automates the discovery of IT resources, simplifying the monitoring of complex and dynamic infrastructure. With its agentless architecture, it supports real-time insights and predictive analytics to optimize IT performance.
Key features:
- Comprehensive infrastructure monitoring: Offers out-of-the-box monitoring capabilities across networks, servers, VMs, storage, and cloud services with over 2000+ integrations for hybrid IT environments.
- Agentless architecture: Simplifies deployment and minimizes overhead by using agentless collectors for data gathering across diverse IT infrastructure components.
- Dynamic thresholds and intelligent alerting: Utilizes AI-driven analytics to set dynamic thresholds for alerts, reducing noise and focusing on critical issues.
- Topology mapping: Automatically generates visual representations of infrastructure dependencies, aiding in quick identification of root causes during troubleshooting efforts.
- Forecasting and trend analysis: Provides predictive insights into resource utilization trends to anticipate potential bottlenecks or capacity issues before they impact operations.
Source: LogicMonitor
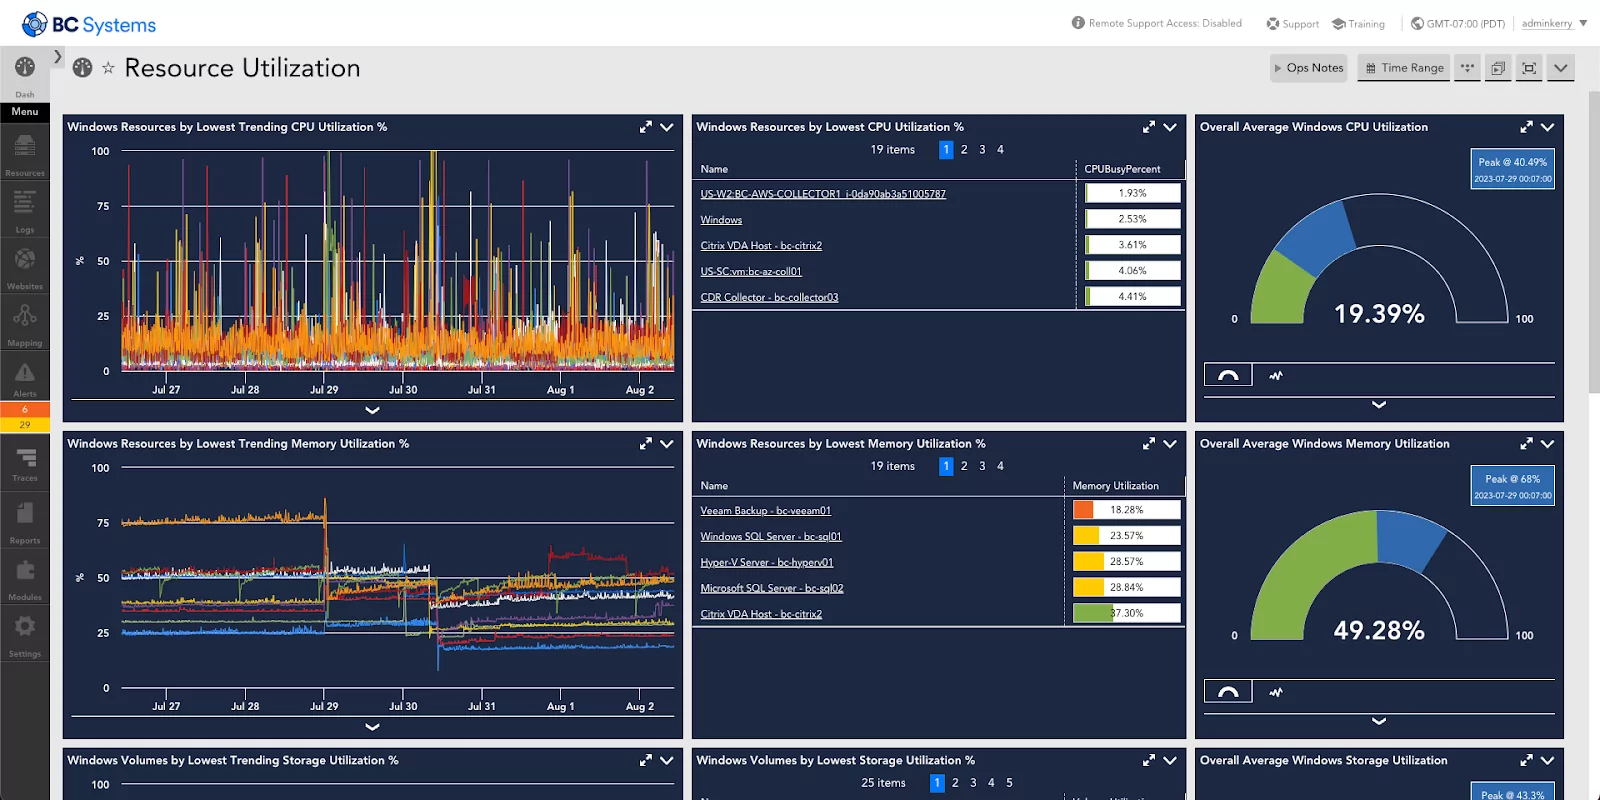
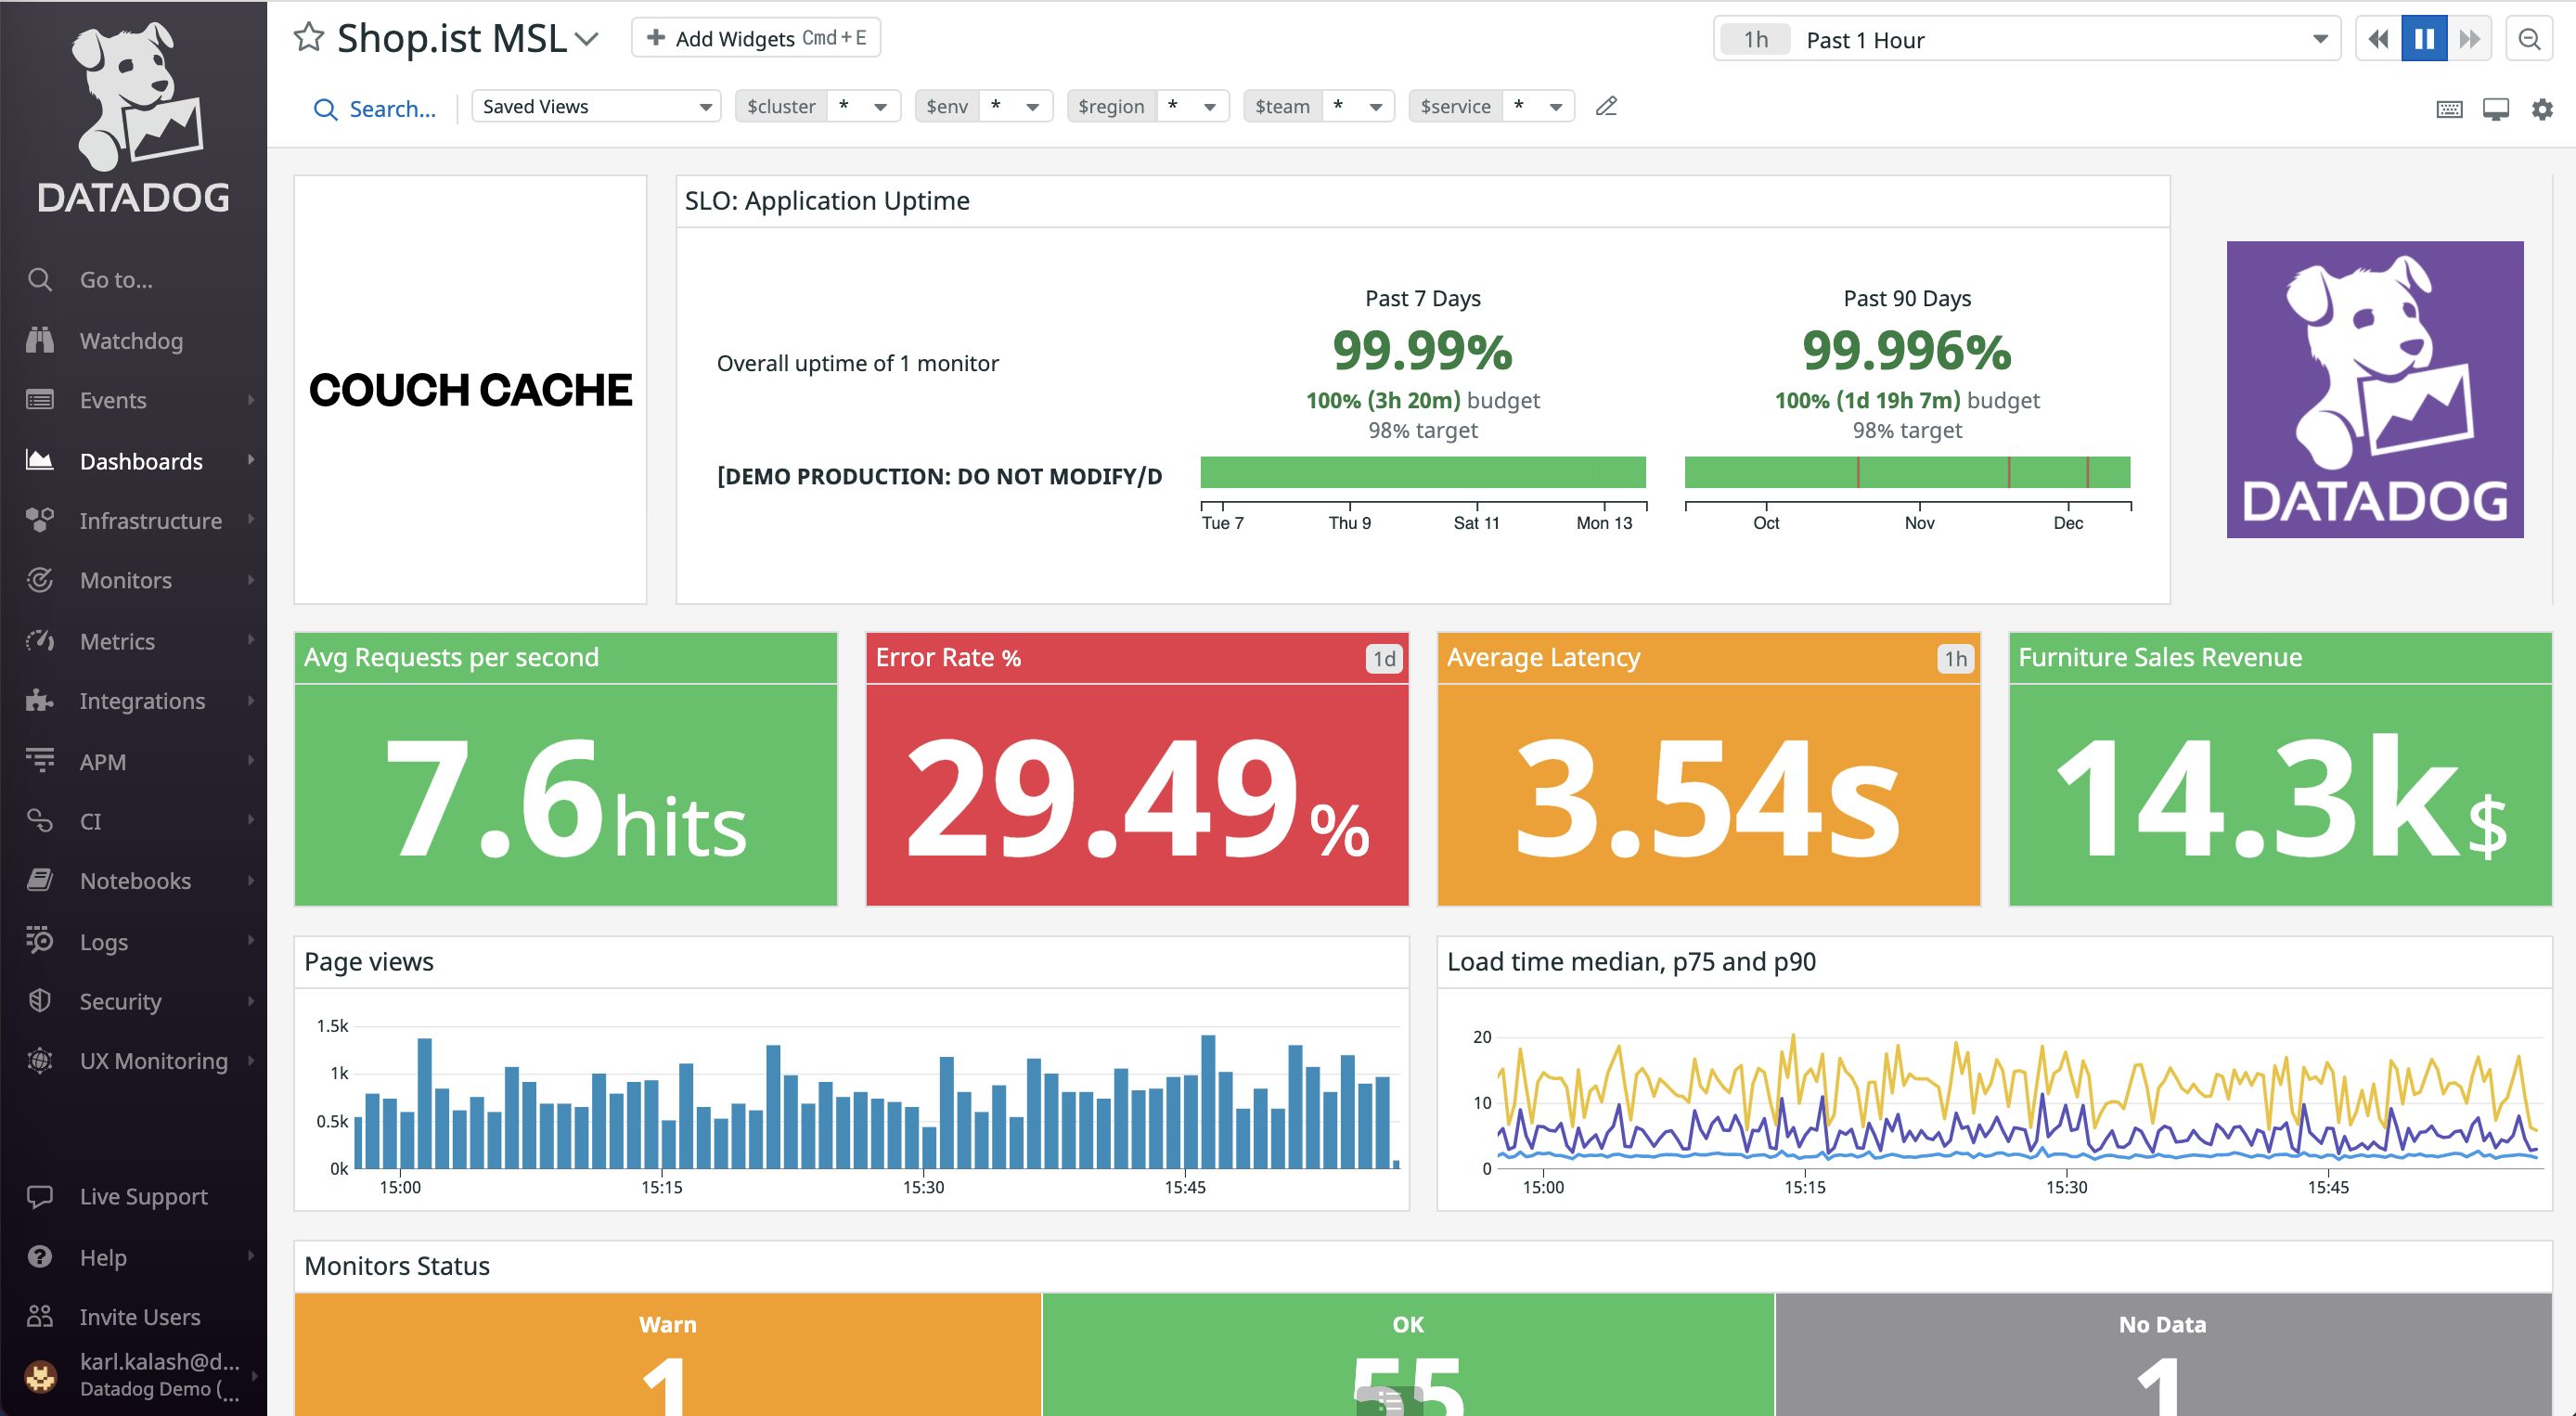
6. Datadog
Datadog provides a SaaS-based infrastructure monitoring solution that provides visibility into the performance and security of IT environments. By offering metrics, visualizations, and alerting, Datadog enables engineering teams to maintain, optimize, and secure cloud or hybrid environments.
Key features:
- Technology coverage: Integrates with over 500 technologies including Kubernetes, serverless platforms, ensuring visibility across any stack whether on-premise, hybrid, IoT, or multi-cloud environments.
- Simple deployment: Facilitates quick setup without professional services or extensive training.
- Machine learning-based alerts: Reduces alert fatigue by employing machine learning tools to distinguish critical issues from regular noise.
- Deep visibility into infrastructure: Offers out-of-the-box monitoring of tens of thousands of metrics with historical records even for ephemeral infrastructure components.
- Metrics without limits: Allows ingestion of all metrics with the flexibility to index essential ones at any time. This feature preserves query accuracy and saves time on proxy maintenance.
- Cloud security posture management: Enhances security posture through continuous configuration checks and supports compliance with major frameworks like PCI DSS and GDPR while detecting cloud vulnerabilities.

Source: Datadog
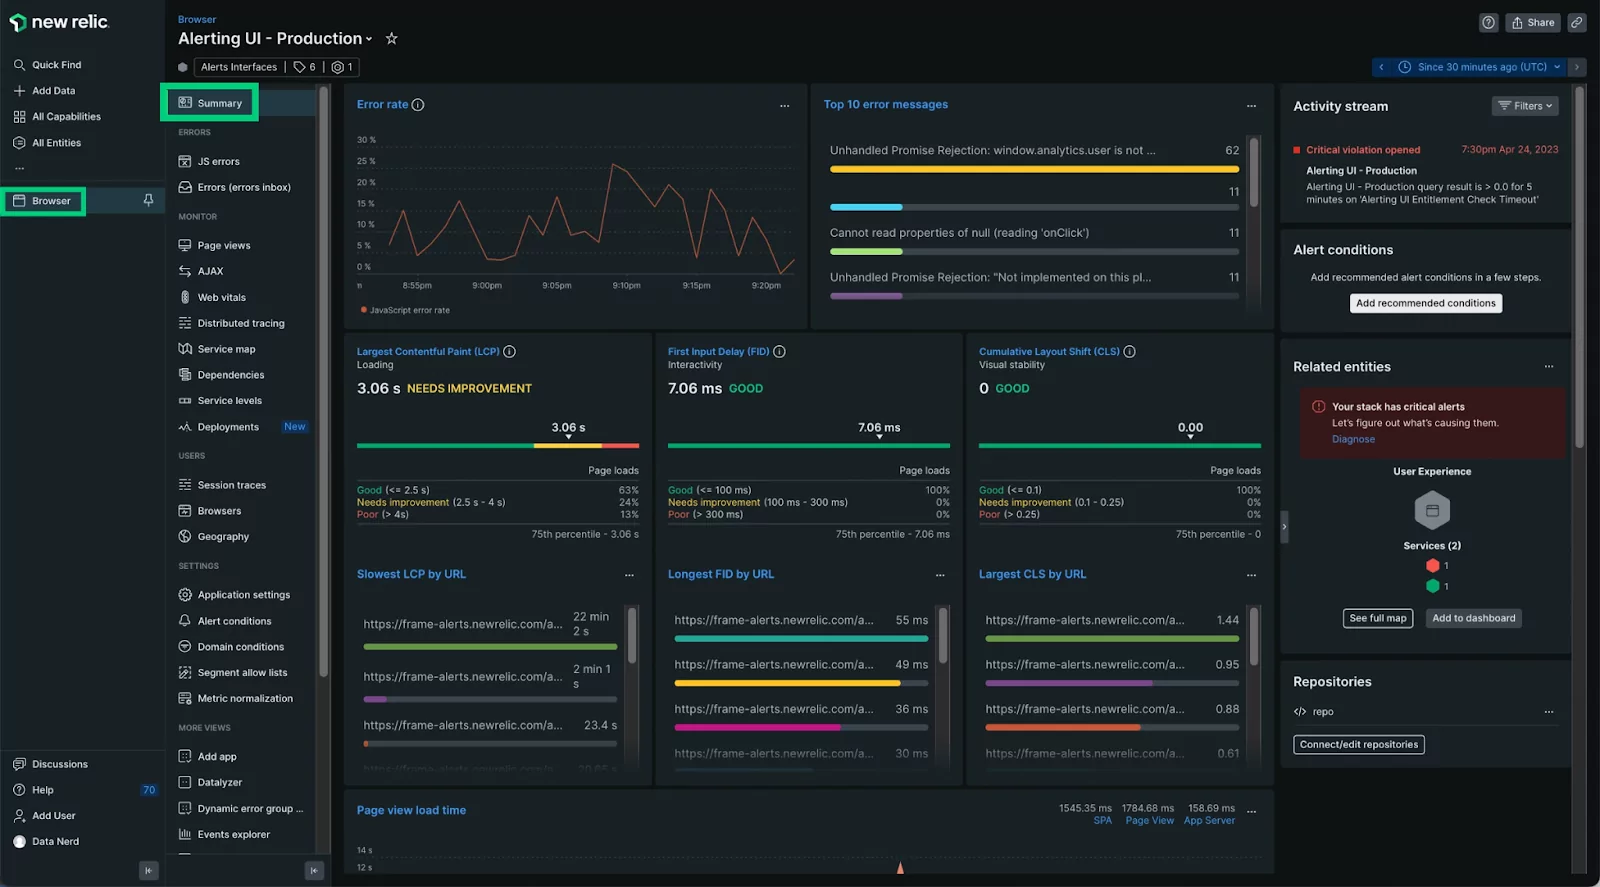
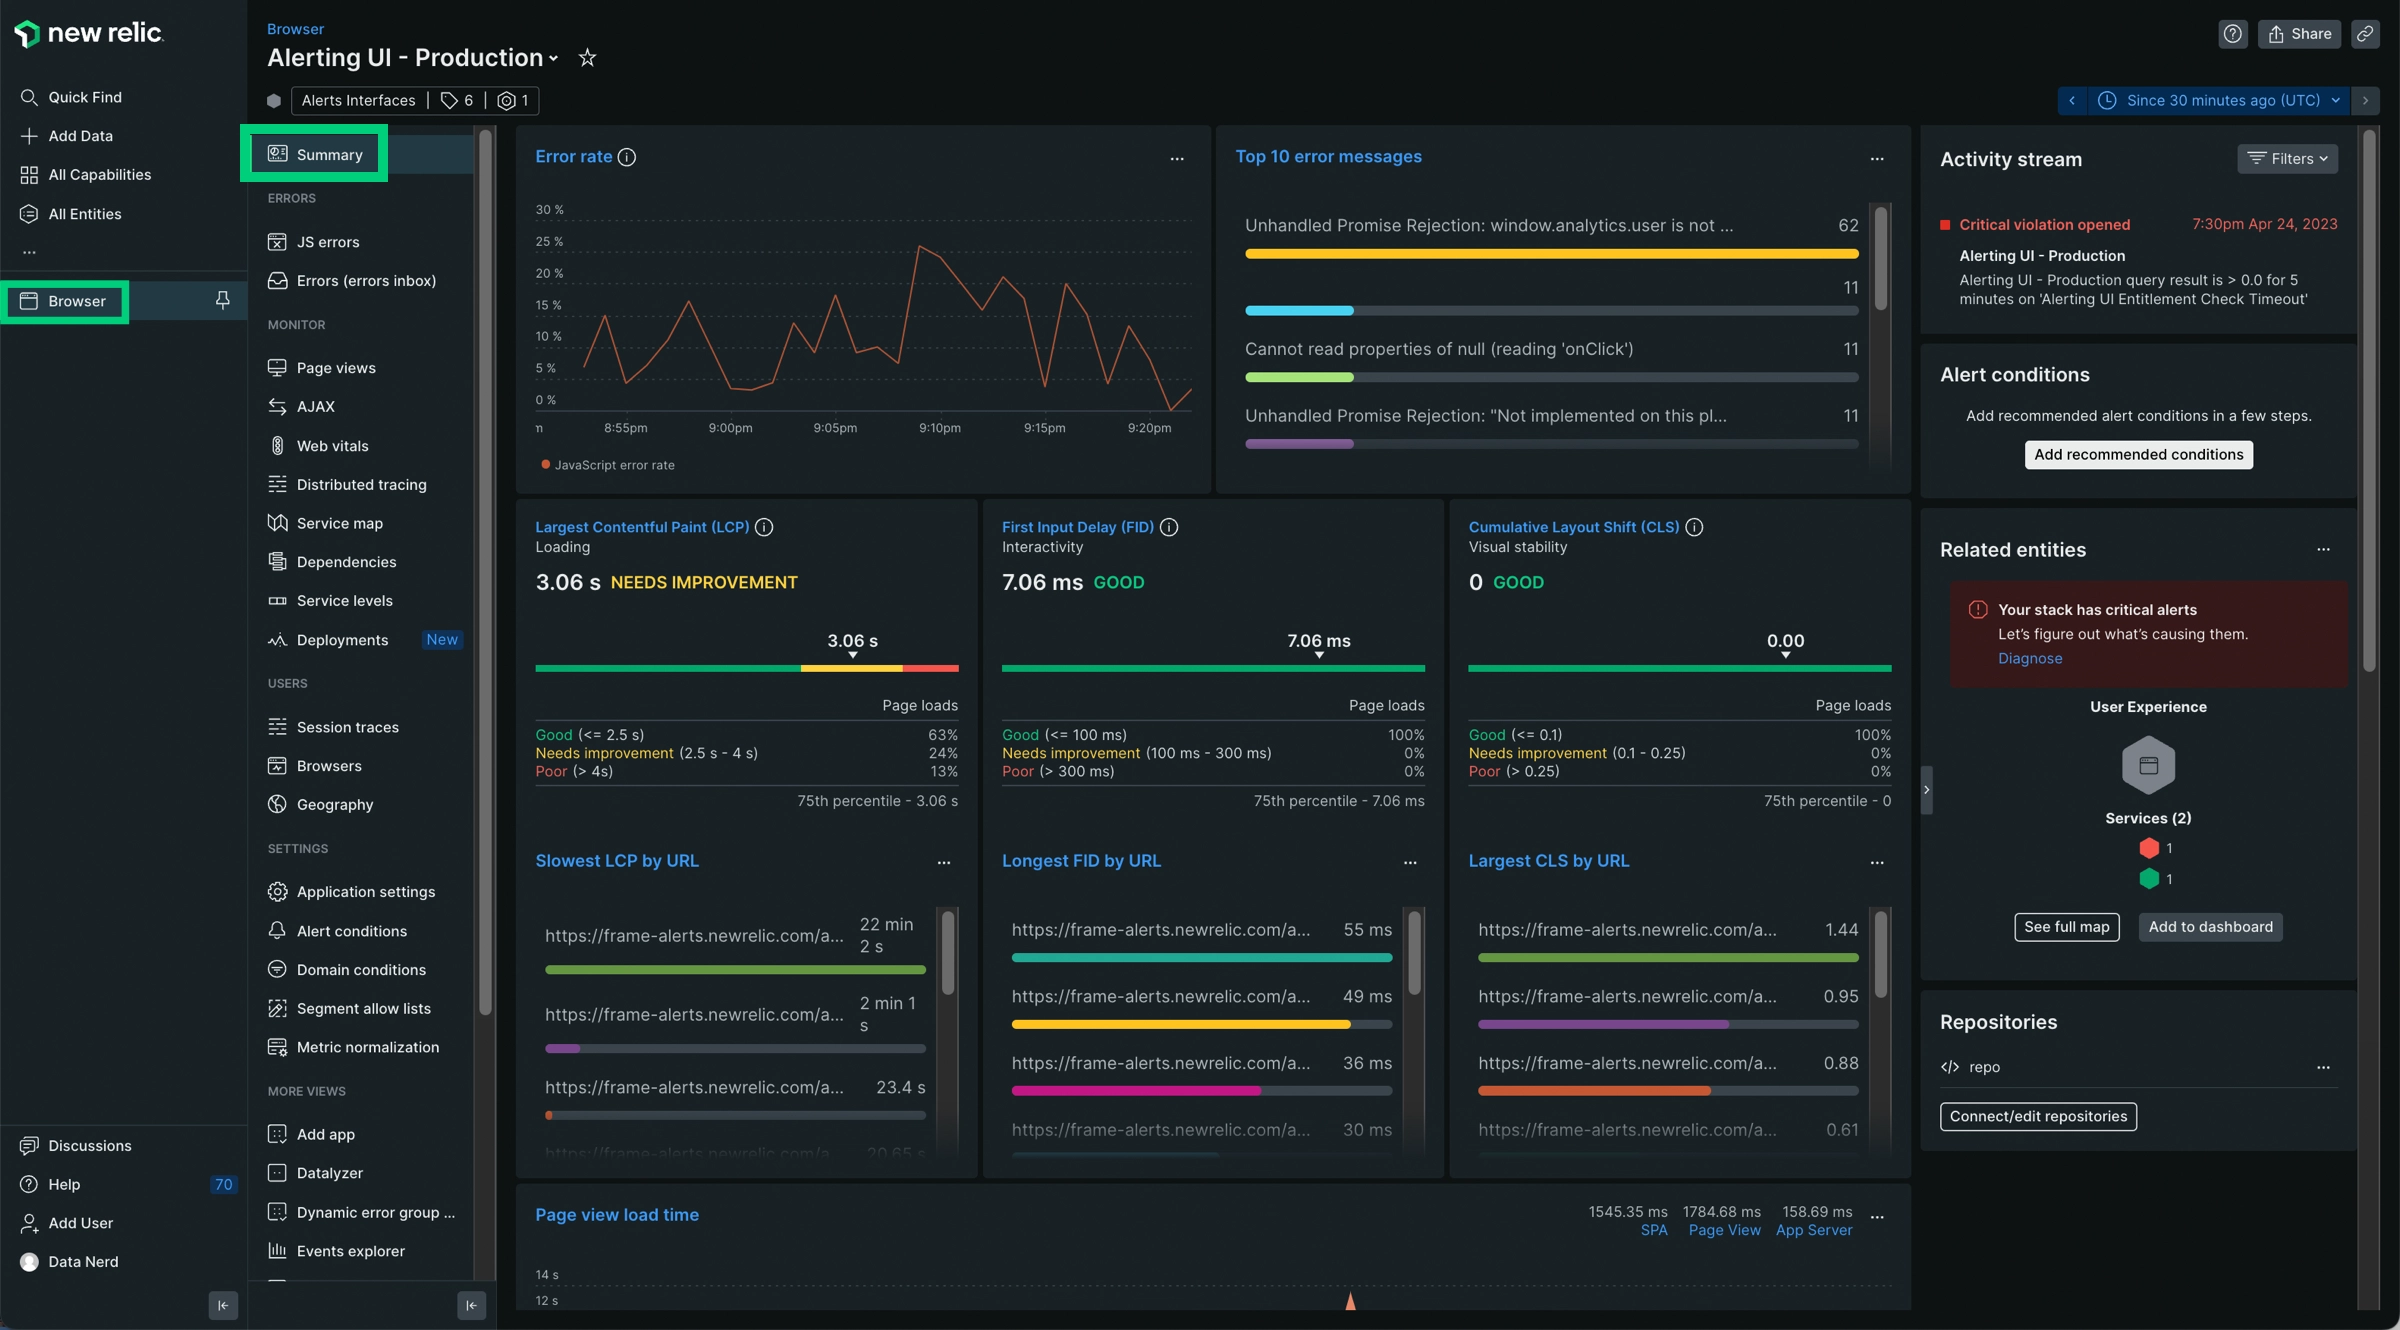
7. New Relic
New Relic is an observability platform that offers in-depth monitoring of infrastructure and applications. It enables teams to quickly identify and troubleshoot issues across their tech stack, from cloud-based services to on-premises environments. New Relic provides a unified view that integrates application performance data with infrastructure health.
Key features:
- Unified observability: Delivers a single platform for monitoring applications, infrastructure, logs, and user experiences, facilitating quick issue identification and resolution.
- Infrastructure monitoring: Offers visibility into cloud and on-premises environments to track the health and performance of hosts, containers, and services.
- Kubernetes monitoring: Provides insights into Kubernetes clusters to optimize deployment configurations and improve resource utilization.
- Application performance management (APM): Enables detailed tracking of application health and performance metrics to enhance user experiences.
- Proactive troubleshooting: Utilizes AI-driven analytics for proactive detection of anomalies and potential issues before they impact users or services.
- Customizable dashboards: Supports the creation of custom dashboards that aggregate data from various sources for tailored insights into system performance.
Source: New Relic
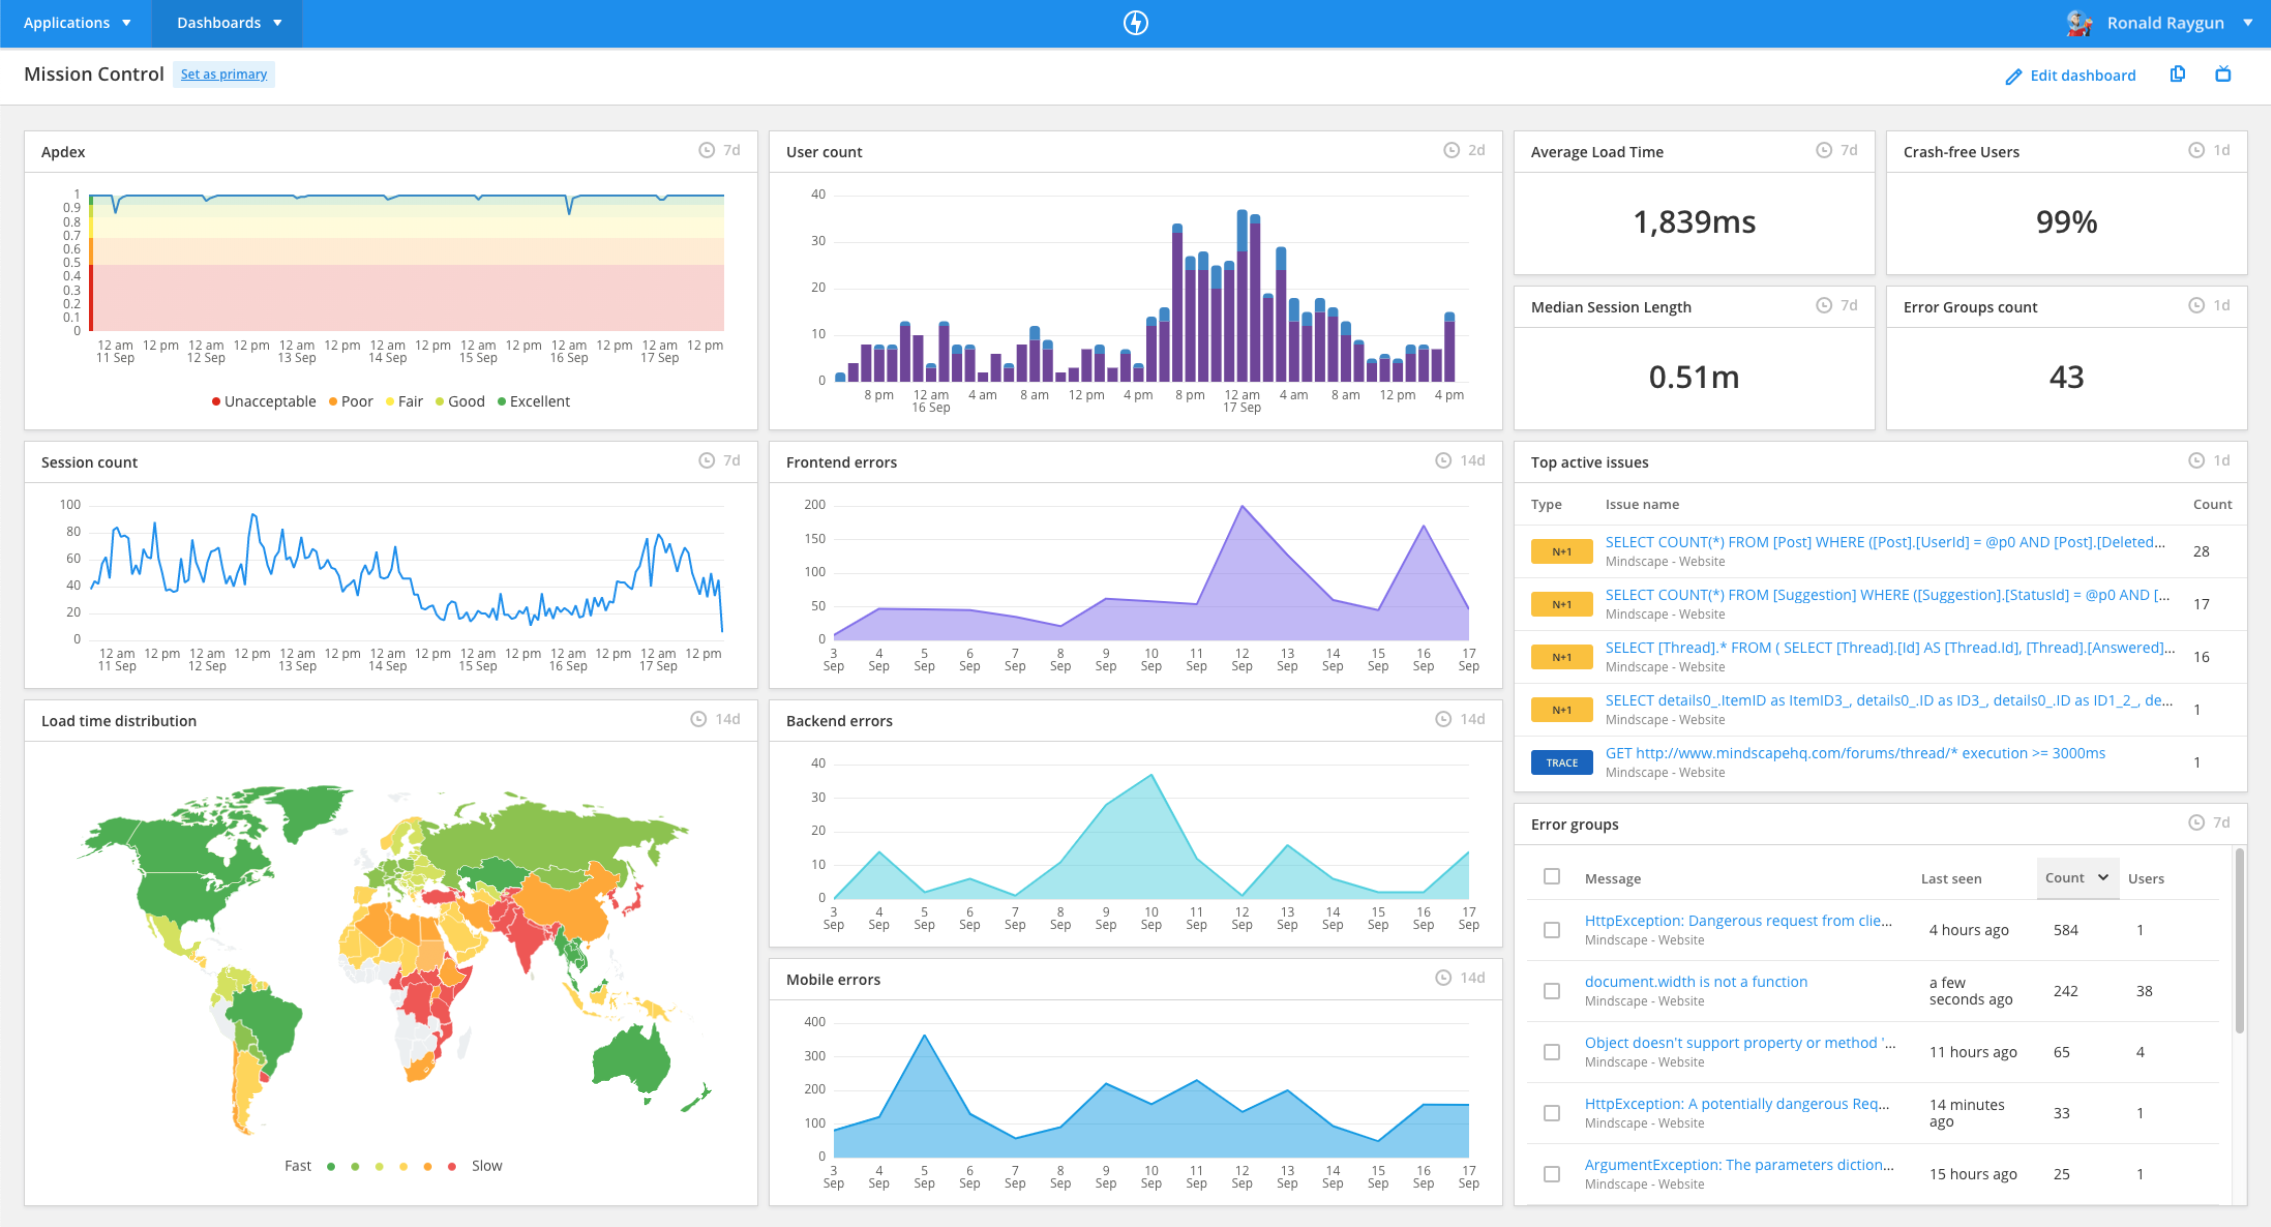
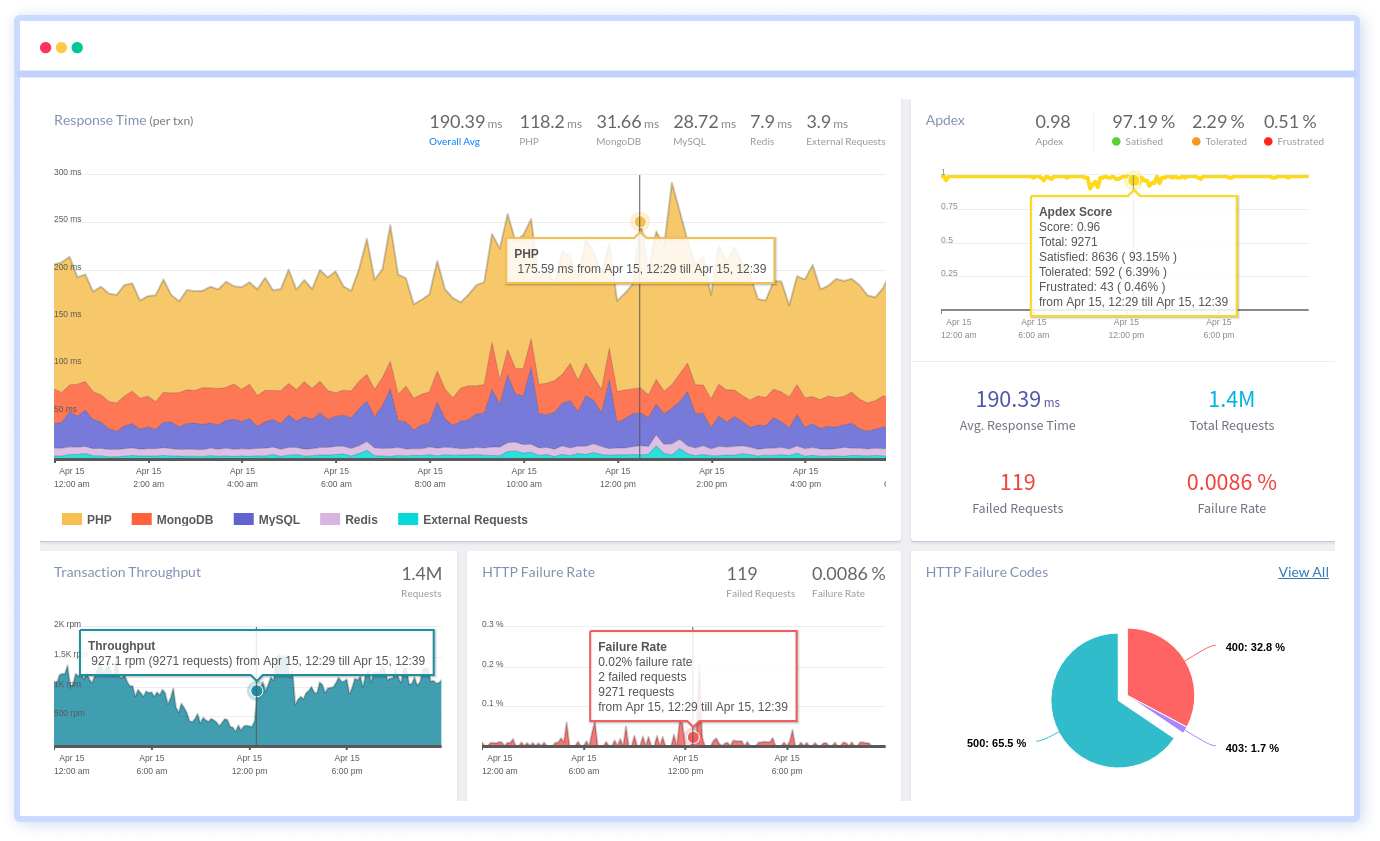
8. Raygun

Raygun is an APM tool offering unparalleled visibility into server-side performance. It allows users to uncover detailed, code-level insights that speed up issue resolution by pinpointing the root cause of performance problems.
Key features:
- Server-side visibility: Offers detail into server-side performance for .NET, Ruby, and Node.js applications with easy-to-install agents that provide control over data sampling.
- Code execution insights: Visualizes code execution down to the millisecond, segmented by methods, requests, queries, and external API calls, making it easier to understand how code behaves in real-world scenarios.
- User experience prioritization: Identifies real-time issues and filters them by type, time, impact level, and frequency to prioritize optimizations.
- Issue resolution workflow: Combines modern UI with code-level diagnostics for fast identification and resolution of high-impact issues.

Source: Raygun
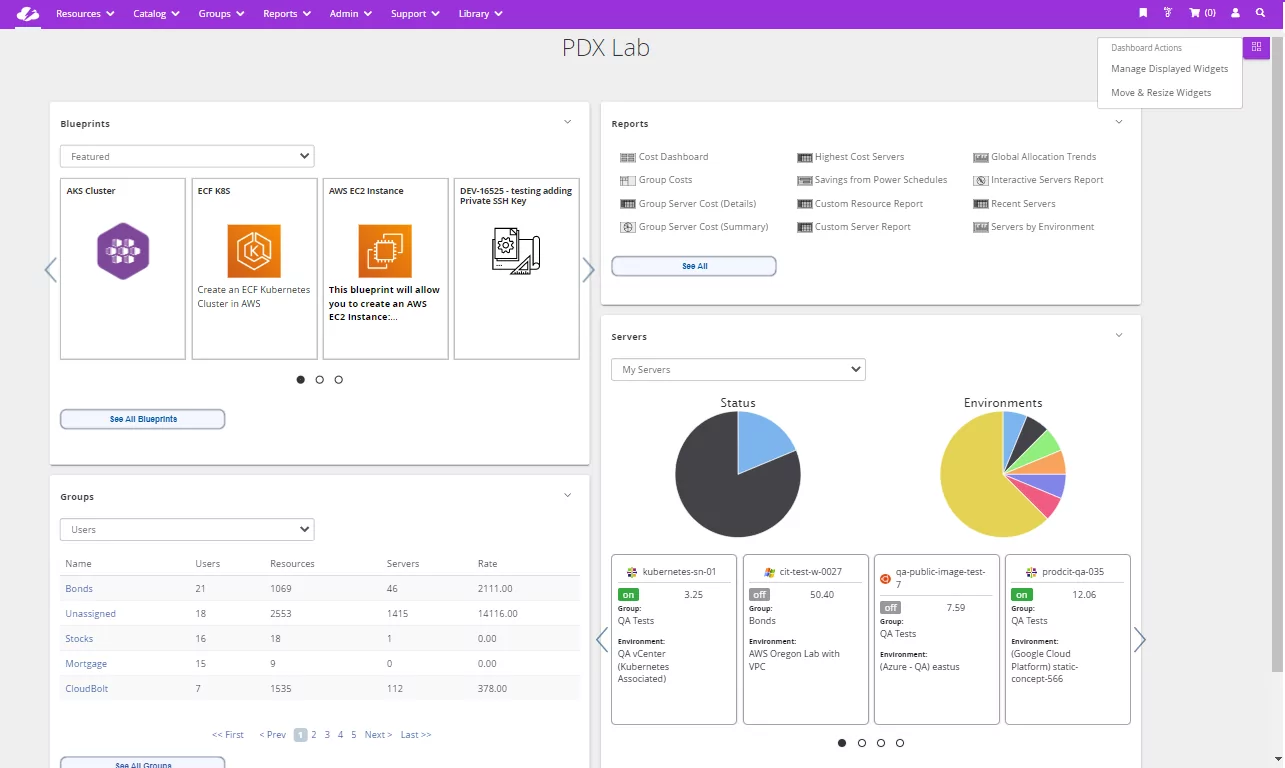
9. CloudBolt

CloudBolt is a cloud management platform designed to simplify the orchestration and automation of cloud infrastructure. It enables organizations to manage their hybrid and multi-cloud environments by offering solutions for cloud cost management, automation, and orchestration.
Key features:
- Cloud-agnostic orchestration: Enables seamless management of resources across different cloud environments including AWS, Azure, Google Cloud, VMware, and Red Hat.
- Self-service automation: Offers services that empower users to deploy infrastructure on-demand without manual intervention.
- Infrastructure management: Centralizes the management process and eliminates manual tasks through intelligent automation capabilities.
- Citizen development: Allows every user to easily browse and deploy infrastructure while adhering to compliance and governance policies.
- Intelligent automation: Automates discovery, governance, optimization of multi-cloud environments from one platform for streamlined operations.
Source: CloudBolt
10. Atatus

Atatus is an APM platform that provides real-time insights into applications, infrastructure, and user experiences. It offers a suite of tools designed to identify, troubleshoot, and resolve performance issues across various environments. It integrates application performance management, real user monitoring, infrastructure monitoring, and log management into one platform.
Key features:
- Application monitoring: Delivers insights into application slowdowns and performance bottlenecks, supporting optimization for improved speed.
- Real user monitoring: Visualizes user experiences from page load to AJAX response times, helping understand front-end app performance from the visitor’s perspective.
- Infrastructure monitoring: Offers a comprehensive view of server health, including CPU, memory, disk utilization in real-time for better resource management.
- Logs monitoring: Enables real-time collection, parsing, and analysis of log data across files, servers, and applications.
- Synthetic monitoring: Ensures app availability with HTTP, SSL/TCP/UDP/DNS uptime checks and alerts teams of slowness or downtime.
- API analytics: Provides metrics on API usage to understand how customers interact with your APIs and optimize their experience.
- Database monitoring: Monitors databases for slow queries and connection issues to maintain peak performance levels effectively.
- Kubernetes monitoring: Enables optimal orchestration by monitoring Kubernetes clusters, pods, nodes ensuring efficiency in containerized environments.

Source: Atatus
Conclusion
While IBM Turbonomic offers robust IT automation and resource optimization, organizations may encounter limitations such as frequent release cycles, scalability challenges, and limited integration options. These factors can prompt the consideration of alternative solutions that better align with specific operational needs, provide more extensive customization, or offer enhanced integration capabilities. Evaluating the unique features and strengths of various competitors can help organizations choose the right platform to optimize their IT infrastructure efficiently.


